EURAUD trade ideas

Euraud (1h)1h structure looks bearish.
Daily pullback eminent.
Will be tradin price to the marhmked 4h zones.


Pending Sell EURAUDTechnically we can wait for pending Sell on the EURAUD pair.
For the position please see the chart above. Don't forget to keep your respective MM and RR.
You can cut profit if it is running according to your wishes.
Don't move SL longer.

Free Trade On EUR/AUD , Reversal Pattern Done ! 250 Pips WaitingHere Is my free trade on EUR/AUD , The price giving an amazing reversal Pattern on 1H T.F ,Head & Shoulders Pattern Very Clear and the price closed below neckline and back again to retest it , so it`s the best place to can enter a short trade with 250 pips target .
This Is An Educational + Analytic Content That Will Teach Why And How To Enter A Trade
Make Sure You Watch The Price Action Closely In Each Analysis As This Is A Very Important Part Of Our Method
Disclaimer : This Analysis Can Change At Anytime Without Notice And It Is Only For The Purpose Of Assisting Traders To Make Independent Investments Decisions.

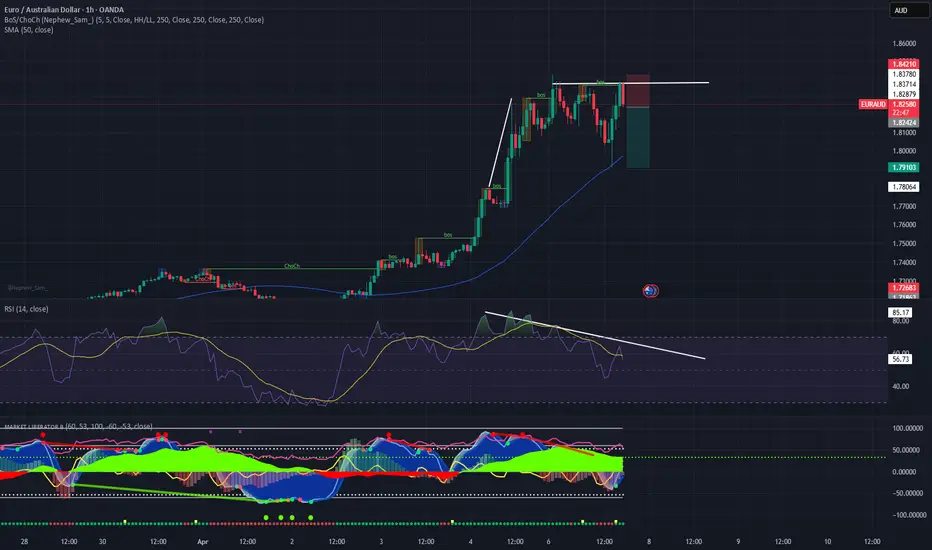
EURAUD | 07.04.2025SELL 1.83100 | STOP 1.85000 | TAKE 1.80000 | Corrective movement from high-price.

EUR/AUD For Bearishyou can go short now
or
wait for entry point and then go short
general trend is up trend
current phase is pull-back and may be finish at target 4
have fun :)

EURAUD head and shoulder patternThis is a strong reversal pattern which points to below the 1.7900 level. This is a complex H&S pattern, but targets the 1.7840 level in the days ahead. We'd need to see some bounce in the equity market to assist a move lower here.

Sell euraud Strong sell coming
Giving the little false breakout of supply zone but respecting the uper trend channel and forming strong weekly sell candel
Remember here we needed big bearish correction

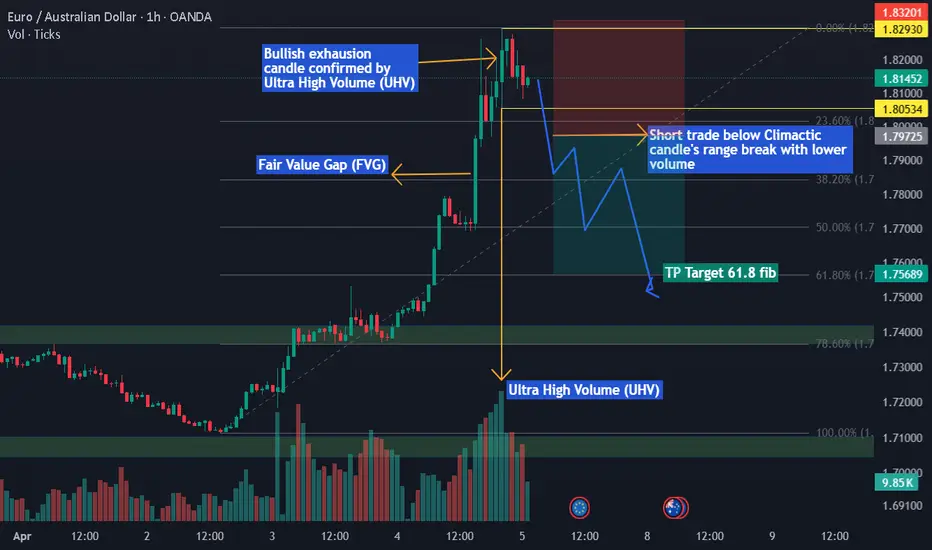
EURAUD VSA (Volume Spread Analysis) Short ideaEURAUD has moved significantly up, according to VSA there is a clear bullish exhaustion candle (Climactic Candle) supported by Ultra High Volume (UHV). The highs and lows of the candle are marked with yellow horizontal ray. Upon break of the lower range of the Climactic Candle by a significant bearish candle with lower volume, I will take a short trade with stop above the previous high and target 61.8% fib level.
Disclaimer: This idea is only for educational purpose and sharing my personal opinion according to VSA method. This is not a financial advice. Do you own research and follow the risk management rules.
EUR AUD #0003 Short Position Trading- The Weekly chart reflected a number of false breakout attempts last few months
- indicating the bullish sentiment is weekend on every attempt to break the nearest monthly HIGH
- The current weekly charts false breakout (refer on monthly candle) enough to potray the exhaustion of Bullish sentiments.
- coupled with the presence of Bearish Order Block at the Top of the Latest weekly false breakout.
- position trading for a short position with SL, TP labeled as drawn on the chart.
the nearest Monthly liquidity L will be the liquidity area for TP.

EUR/AUD, 15 MIN, Short SetupEUR/AUD, 15 MIN, Short Setup
Double top and Bearish divergence on RSI
1:1.8 RRR

EURAUD | H4 Market OutlookFUSIONMARKETS:EURAUD is approaching a buy area currently. It's a good opportunity to consider entering the market for potential gains.

EURAUD bull flag has completed following the China tariff news!Intraday Update: The EURAUD has completed the bull flag pattern. However, with the headlines today out of China, the risk is we could continue to squeeze, and target is a guess at this point.
Some traders will fade this, I would wait till after US stocks markets reopen

euraud analysis elliot. Don't forget about stop-loss.
Write in the comments all your questions and instruments analysis of which you want to see.
Friends, push the like button, write a comment, and share with your mates - that would be the best THANK YOU.
P.S. I personally will open entry if the price will show it according to my strategy.
Always make your analysis before a trade

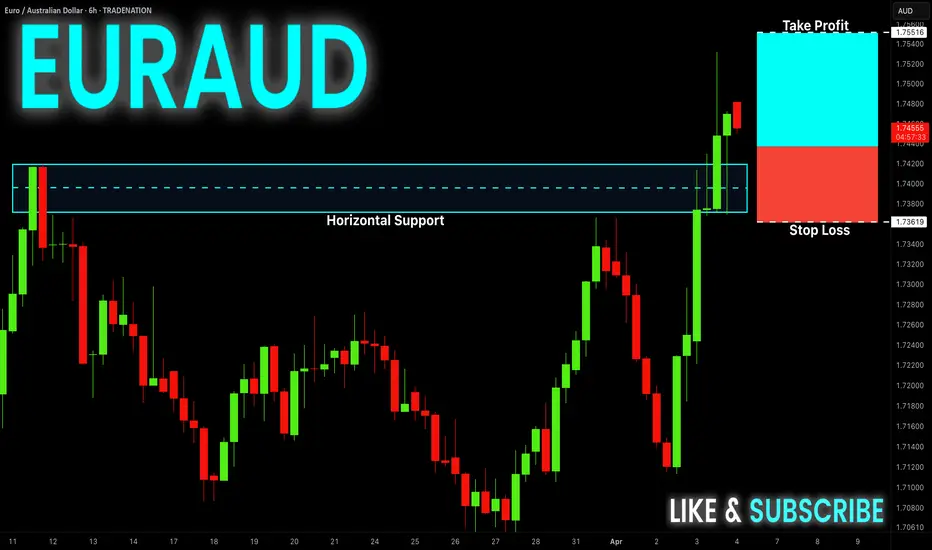
EUR-AUD Free Signal! Buy!
Hello,Traders!
EUR-AUD is trading in a
Strong uptrend and the
Pair made a bullish breakout
And a retest of the key
Horizontal level of 1.7420
And is going up now so
We can enter a long trade
On a local pullback with
The Take Profit of 1.7551
And the Stop Loss of 1.7362
Buy!
Comment and subscribe to help us grow!
Check out other forecasts below too!
Disclosure: I am part of Trade Nation's Influencer program and receive a monthly fee for using their TradingView charts in my analysis.
EURAUD Trade Analysis + Result, TP ViolatedAnother textbook trade executed to perfection! 🎯 We spotted a key demand zone around 1.71112, aligning with the weekly low, and took a high-probability long entry. Price showed strong bullish momentum, breaking past resistance levels and targeting the liquidity above previous highs.
📌 Trade Breakdown:
✅ Entry: based off FVG that last week's move left
✅ Confirmation: Strong bullish structure shift
✅ Target: liquidity i.e equal highs
Patience and smart execution paid off once again! Keeping an eye on price action for the next potential setup. 📈🔥
unto the next, let's fvcking gooo!
#EURAUD #ForexTrading #LiquidityGrab #SmartMoney #TradingView #TPHit 🚀

EURAUD Short Term Buy Idea Update!!!Hi Traders, on March 18th I shared this "EURAUD Short Term Buy Idea Follow Up"
I expected pullbacks towards the marked key support zones and then a potential continuation higher. You can read the full post using the link above.
Price reached the first key support zone, respected it and bounced higher as expected!!!
If you enjoy this idea, don’t forget to LIKE 👍, FOLLOW ✅, SHARE 🙌, and COMMENT ✍! Drop your thoughts and charts below to keep the discussion going. Your support helps keep this content free and reach more people! 🚀
---------------------------------------------------------------------------------------------------------------------
Disclosure: I am part of Trade Nation's Influencer program and receive a monthly fee for using their TradingView charts in my analysis.

euraud sell signal. Don't forget about stop-loss.
Write in the comments all your questions and instruments analysis of which you want to see.
Friends, push the like button, write a comment, and share with your mates - that would be the best THANK YOU.
P.S. I personally will open entry if the price will show it according to my strategy.
Always make your analysis before a trade

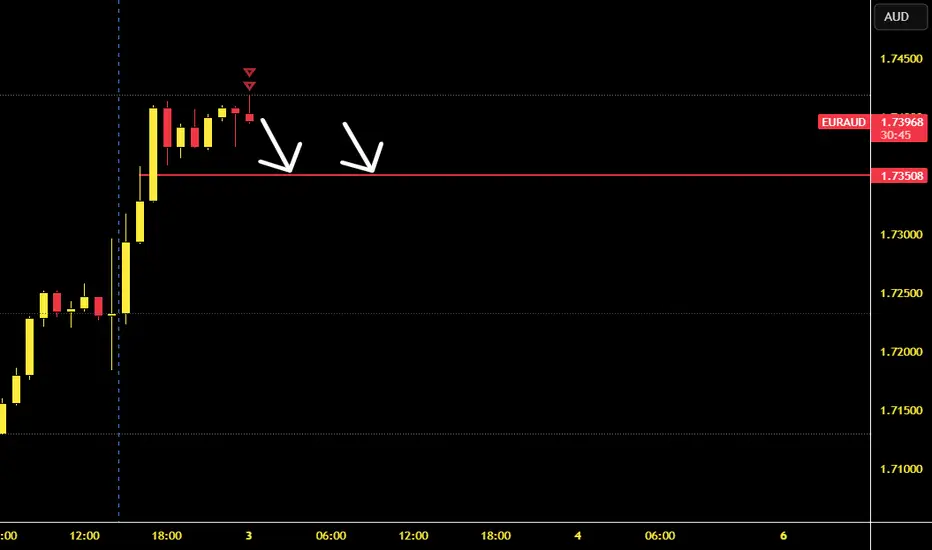
EURAUD – Short Setup DevelopingEURAUD – Short Setup Developing
🔻 Short Bias | 🎯 Target: 1.73508 | ⏳ Deadline: April 4
Price is hovering near recent highs, and structure suggests a potential shift lower. Eyeing 1.73508 as the next magnet if momentum shifts. Already positioned short and watching for follow-through.
💡 All trades can be replayed on TradingView for confirmation.
#EURAUD #Forex #ShortSetup #MarketAnalysis #GlobalHorns