EURAUD AnalysisAs of March 13, 2025, the EUR/AUD currency pair is trading around 1.7326. citeturn0search6
Technical analysis indicates a strong bullish trend:
- **TradingView**'s technical ratings show a 'Strong Buy' signal for both the 1-week and 1-month periods. citeturn0search1
- **Investing.com**'s analysis also suggests a 'Strong Buy' based on various moving averages and technical indicators. citeturn0search3
It's important to note that currency markets can be highly volatile, and past performance does not guarantee future results. Therefore, it's advisable to consider multiple factors, including economic indicators and geopolitical events, before making any trading decisions.
EURAUD trade ideas

Thu 13th Mar 2025 EUR/AUD Daily Forex Chart Sell SetupGood morning fellow traders. On my Daily Forex charts using the High Probability & Divergence trading methods from my books, I have identified a new trade setup this morning. As usual, you can read my notes on the chart for my thoughts on this setup. The trade being a EUR/AUD Sell. Enjoy the day all. Cheers. Jim

EUR/AUD D Closure Is Amazing , Short Setup Valid To Get 250 PipsWe have a very good daily closure in bearish in this pair and i think the price will go down a little after this huge movement to upside without any correction , so i think this res will be the best place tp can sell this pair and at least 250 pips target !
This Is An Educational + Analytic Content That Will Teach Why And How To Enter A Trade
Make Sure You Watch The Price Action Closely In Each Analysis As This Is A Very Important Part Of Our Method
Disclaimer : This Analysis Can Change At Anytime Without Notice And It Is Only For The Purpose Of Assisting Traders To Make Independent Investments Decisions.

EUR/AUD Short Trade SetupThe EUR/AUD currency pair has experienced a sharp upward movement, reaching a key resistance level. Given the overbought conditions indicated by the Stochastic Momentum Index (SMI) and historical price action, a potential reversal is anticipated. The trade setup involves entering a short position near the 1.72576 level, with a stop loss set around 1.74375 to manage risk, and a take profit target at 1.63719, aligning with a previous support zone. This setup offers a favorable risk-to-reward ratio if the price follows the expected downward correction.

EUR/AUD Long Setup – 15M ChartPrice is reacting off a key demand zone after a bearish move, showing potential signs of reversal. Entry is based on bullish rejection at support, aligning with the 9 EMA as dynamic resistance turned potential support. Targeting 1.74203 with a stop below the zone around 1.72305, offering a favorable risk-to-reward ratio. Waiting for bullish confirmation to follow through.

EURAUD Swing Trade Recap: 916 Pips SecuredEURAUD Swing Trade Recap: 916 Pips Secured 🚀
📌 Trade Overview:
Entry: 1.64185 (Feb 20, 2025)
Exit: 1.73345 (Mar 13, 2025)
Duration: 21 days
Pips Gained: 916 ✅
Stop Loss: 1.63136
📊 Why I Took the Trade:
Uptrend Confirmation 📈 – Higher highs & higher lows on the daily chart.
Oversold Conditions 🔄 – RSI signaled a potential bounce.
Bullish Pattern 🏆 – Symmetrical triangle breakout on the 4H chart.
🌍 Fundamental Factors:
Eurozone Strength 🇪🇺 – Steady growth & rising employment.
Australian Weakness 🇦🇺 – Market hit by U.S. tariffs & economic concerns.
📉 Why I Exited:
Key Resistance Zone ⚠️ – Price reached a major level at 1.7330.
Risk Management 🎯 – Locked in profits before potential reversal.
💡 Takeaway:
This trade combined strong technical signals with key fundamentals, leading to a high-probability setup. Exiting at resistance secured profits while keeping risk in check. 🔥
#Forex #EURAUD #SwingTrade #TradingStrategy #RiskManagement

12.03.25 Morning ForecastPairs on Watch -
FX:USDJPY
FX:GBPUSD
FX:EURAUD
A short overview of the instruments I am looking at for today, multi-timeframe analysis down to what I will be looking at for an entry. Enjoy!

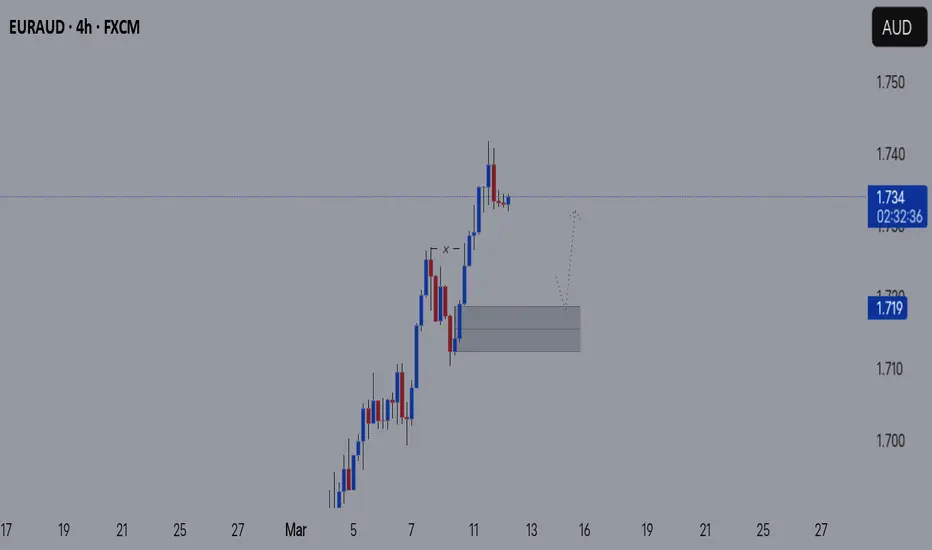
EUR/AUD BULLISH SETUPEur/Aud 4H📊
Trend: Bullish📈
Strategy: Supply and Demand📉📈
We have a recent expansion to the upside and a premium demand zone that remains unmitigated. If price reacts positively on the zone, look to go long until price hits last swing as TP⬆️
EURAUD FORECASTTraders! This pair is looking fantastic due to how the structures develop. It is one of my higher-probability setups. Everything is looking good from the higher timeframe, and we have definitely seen a confirmation in the lower timeframe, which is a tight flag.
But remember guys no matter how good the setup is remember to manage risk! Risk only 1% of your total capital

euraud sell signal. Don't forget about stop-loss.
Write in the comments all your questions and instruments analysis of which you want to see.
Friends, push the like button, write a comment, and share with your mates - that would be the best THANK YOU.
P.S. I personally will open entry if the price will show it according to my strategy.
Always make your analysis before a trade

EURAUD is tanking up, President Lagards will push the price highProbability: High
Position: Long
Context: 4H bullish imbalance

EURAUD challenging important resistance at 1.7330The EURAUD currency pair maintains a bullish sentiment, supported by the prevailing long-term uptrend. However, recent price action suggests an overextended bullish breakout, approaching significant resistance zones on both daily and weekly timeframes.
The key trading level to watch is 1.7050. A potential overbought pullback from current levels, followed by a bullish rebound from 1.7050, could extend the upside, targeting 1.7320, with further resistance at 1.7676 and 1.7800 over a longer timeframe.
Conversely, a confirmed break below 1.7050, with a daily close under this level, could signal a corrective pullback towards 1.6880 and 1.6800.
Conclusion:
While the broader trend remains bullish, the current overextended move suggests the possibility of short-term retracements. Holding 1.7050 as support will be critical for further upside continuation, while a breakdown below this level could trigger deeper corrections. Traders should monitor price action closely and adjust risk management accordingly.
This communication is for informational purposes only and should not be viewed as any form of recommendation as to a particular course of action or as investment advice. It is not intended as an offer or solicitation for the purchase or sale of any financial instrument or as an official confirmation of any transaction. Opinions, estimates and assumptions expressed herein are made as of the date of this communication and are subject to change without notice. This communication has been prepared based upon information, including market prices, data and other information, believed to be reliable; however, Trade Nation does not warrant its completeness or accuracy. All market prices and market data contained in or attached to this communication are indicative and subject to change without notice.

EURAUD Short Daily Chart Trend line + BB + Fibo E 361.80EURAUD Short Daily Chart Trend line + BB + Fibo E 361.80
It can go down much more than our take profit price

EURAUD Take it or Leave it.EURAUD Performance 1W 2.59% 1M 4.58% and 3M 4.69%. High impact news of GBP and USD from this week can push the price higher.

EUR_AUD WIlL KEEP GROWING|LONG|
✅EUR_AUD made a bullish
Breakout of the key horizontal
Level of 1.7162 and the breakout
Is confirmed so we are bullish
Biased and we will be expecting
A further move up
LONG🚀
✅Like and subscribe to never miss a new idea!✅

EUR-AUD Bullish Breakout! Buy!
Hello,Traders!
EUR-AUD is trading in an
Uptrend and the pair made
Made a bullish breakout
Of the key horizontal level
Of 1.7145 which is now
A support then made a
Bullish rebound so we are
Bullish biased and we
Will be expecting a
Further move up
Buy!
Comment and subscribe to help us grow!
Check out other forecasts below too!
Disclosure: I am part of Trade Nation's Influencer program and receive a monthly fee for using their TradingView charts in my analysis.

EURAUD continues to flirt with the highest point of 2024We mentioned this pair last week and told you to keep an eye on the highest point of 2024. And there we are, MARKETSCOM:EURAUD is flirting with that area. If we continue to see the rate struggling to remain above that hurdle, there might be a chance for a slight retracement.
What do you think?
Let's dig in!
FX_IDC:EURAUD
Let us know what you think in the comments below.
Thank you.
74.2% of retail investor accounts lose money when trading CFDs with this provider. You should consider whether you understand how CFDs work and whether you can afford to take the high risk of losing your money. Past performance is not necessarily indicative of future results. The value of investments may fall as well as rise and the investor may not get back the amount initially invested. This content is not intended for nor applicable to residents of the UK. Cryptocurrency CFDs and spread bets are restricted in the UK for all retail clients.

EURAUD 30M TimeFrame SellTotal trend of EURAUD is Bullish but i saw some little movements of changing trend
so i recommend to use very close stoploss


Sell euraudStrong sell possible
Monthly sell structure
Weekly , monthly overbought pairs
Last week little false breakout but candel closed in the zone uper sell trend tested

EUR/AUD Potential HTF Head Shoulder PatternHi Traders.
Like you see in the chart we see, in the daily time frame a potential HnS Pattern is forming.
At the moment we are still very bullish but we are also at the top of the structure.
So maybe we can expect from here some momentum shift. Wait for some bearish conformation
to confirm this setup

euraud sell signal. Don't forget about stop-loss.
Write in the comments all your questions and instruments analysis of which you want to see.
Friends, push the like button, write a comment, and share with your mates - that would be the best THANK YOU.
P.S. I personally will open entry if the price will show it according to my strategy.
Always make your analysis before a trade

EURAUD Bullish overextended rallyThe EURAUD currency pair maintains a bullish sentiment, supported by the prevailing long-term uptrend. However, recent price action suggests an overextended bullish breakout, approaching significant resistance zones on both daily and weekly timeframes.
The key trading level to watch is 1.7050. A potential overbought pullback from current levels, followed by a bullish rebound from 1.7050, could extend the upside, targeting 1.7320, with further resistance at 1.7676 and 1.7800 over a longer timeframe.
Conversely, a confirmed break below 1.7050, with a daily close under this level, could signal a corrective pullback towards 1.6880 and 1.6800.
Conclusion:
While the broader trend remains bullish, the current overextended move suggests the possibility of short-term retracements. Holding 1.7050 as support will be critical for further upside continuation, while a breakdown below this level could trigger deeper corrections. Traders should monitor price action closely and adjust risk management accordingly.
This communication is for informational purposes only and should not be viewed as any form of recommendation as to a particular course of action or as investment advice. It is not intended as an offer or solicitation for the purchase or sale of any financial instrument or as an official confirmation of any transaction. Opinions, estimates and assumptions expressed herein are made as of the date of this communication and are subject to change without notice. This communication has been prepared based upon information, including market prices, data and other information, believed to be reliable; however, Trade Nation does not warrant its completeness or accuracy. All market prices and market data contained in or attached to this communication are indicative and subject to change without notice.
