EURCADWEEKLY is bullish, I'm expecting the continuation if price breaks above the bearish candles and gives us a bullish OB. Then we can buy back to the weekly high. confirmation is waiting for the 4h bullish OB to form.
EURCAD trade ideas

YOU MUST BE A CONFLUENCE FINDER, let me explain.......All the information you need to find a high probability trade are in front of you on the charts so build your trading decisions on 'the facts' of the chart NOT what you think or what you want to happen or even what you heard will happen. If you have enough facts telling you to trade in a certain direction and therefore enough confluence to take a trade, then this is how you will gain consistency in you trading and build confidence. Check out my trade idea!!
www.tradingview.com

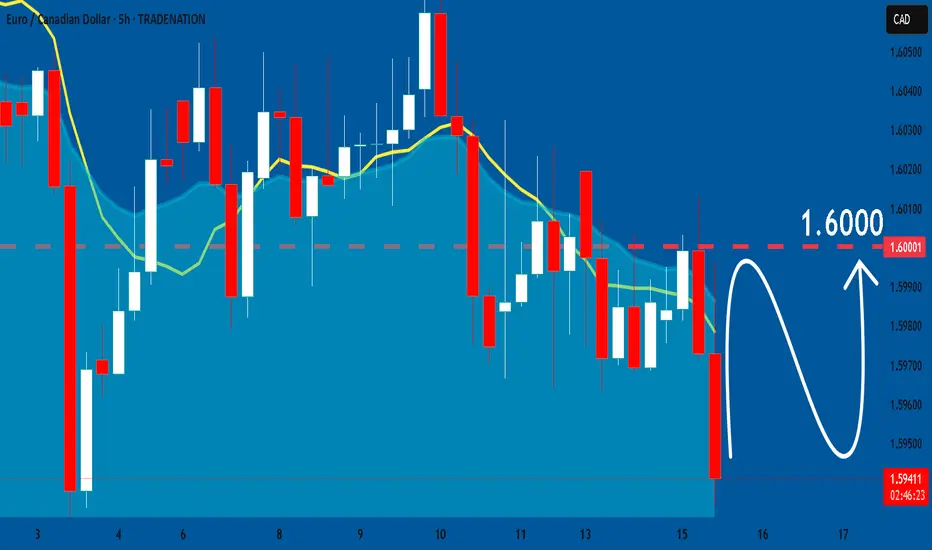
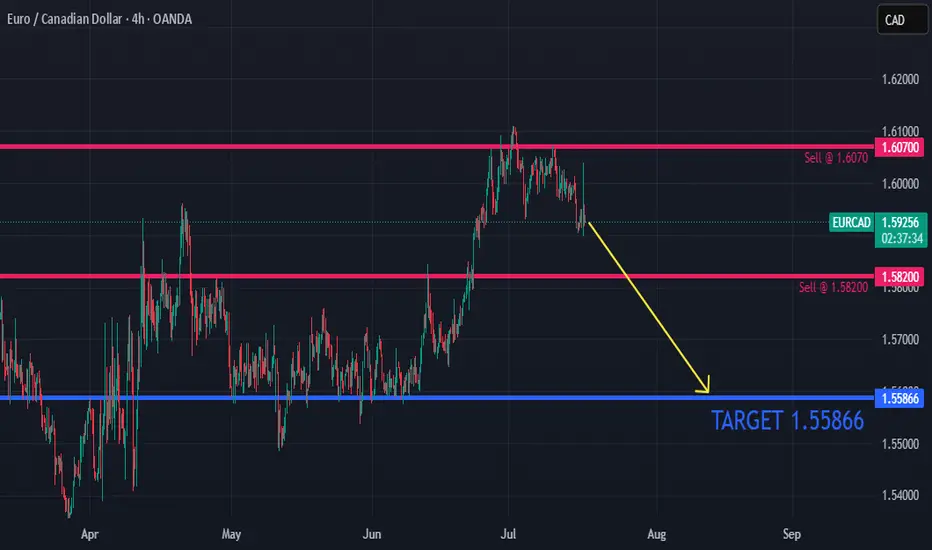
EURCAD Breakdown and Retest , All Eyes on SellingHello Traders
In This Chart EURCAD HOURLY Forex Forecast By FOREX PLANET
today EURCAD analysis 👆
🟢This Chart includes_ (EURCAD market update)
🟢What is The Next Opportunity on EURCAD Market
🟢how to Enter to the Valid Entry With Assurance Profit
This CHART is For Trader's that Want to Improve Their Technical Analysis Skills and Their Trading By Understanding How To Analyze The Market Using Multiple Timeframes and Understanding The Bigger Picture on the Charts

EURCAD LONGBy utilizing Fibonacci retracement levels, historical patterns, , we can formulate a hypothesis that the market might follow a similar trajectory if bullish sentiment prevails.

EUR/CAD: Quant-Verified ReversalThe fundamental catalyst has been triggered. The anticipated strong Canadian CPI data was released as expected, confirming the primary driver for this trade thesis. Now, the focus shifts to the technical structure, where price is showing clear exhaustion at a generational resistance wall. 🧱
Our core thesis is that the confirmed fundamental strength of the CAD will now fuel the technically-indicated bearish reversal from this critical price ceiling.
The Data-Driven Case 📊
This trade is supported by a confluence of technical, fundamental, and quantitative data points.
Primary Technical Structure: The pair is being aggressively rejected from a multi-year resistance zone (1.6000 - 1.6100). This price action is supported by a clear bearish divergence on the 4H chart's Relative Strength Index (RSI), a classic signal that indicates buying momentum is fading despite higher prices.
Internal Momentum Models: Our internal trend and momentum models have flagged a definitive bearish shift. Specifically, the MACD indicator has crossed below its signal line into negative territory, confirming that short-term momentum is now bearish. This is layered with a crossover in our moving average module, where the short-term SMA has fallen below the long-term SMA, indicating the prevailing trend structure is now downward.
Quantitative Probability & Volatility Analysis: To quantify the potential outcome of this setup, we ran a Monte Carlo simulation projecting several thousand potential price paths. The simulation returned a 79.13% probability of the trade reaching our Take Profit target before hitting the Stop Loss. Furthermore, our GARCH volatility model forecasts that the expected price fluctuations are well-contained within our defined risk parameters, reinforcing the asymmetric risk-reward profile of this trade.
The Execution Plan ✅
Based on the synthesis of all data, here is the actionable trade plan:
📉 Trade: Sell (Short) EUR/CAD
👉 Entry: 1.6030
⛔️ Stop Loss: 1.6125
🎯 Take Profit: 1.5850
The data has spoken, and the setup is active. Trade with discipline.

EURCAD: Bullish Forecast & Bullish Scenario
The price of EURCAD will most likely increase soon enough, due to the demand beginning to exceed supply which we can see by looking at the chart of the pair.
Disclosure: I am part of Trade Nation's Influencer program and receive a monthly fee for using their TradingView charts in my analysis.
❤️ Please, support our work with like & comment! ❤️
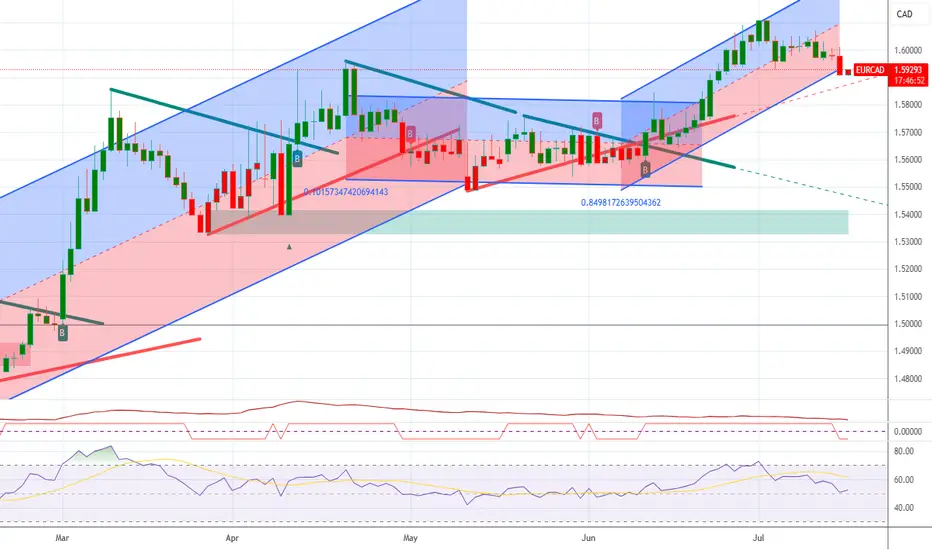
EURCAD - Weekly Resistance Might Shift The Momentum!Hello TradingView Family / Fellow Traders. This is Richard, also known as theSignalyst.
📈EURCAD has been overall bullish trading within the rising channel marked in blue. However, it is currently approaching the upper bound of the channel.
Moreover, the red zone is a strong weekly resistance.
🏹 Thus, the highlighted red circle is a strong area to look for sell setups as it is the intersection of the upper blue trendline and resistance.
📚 As per my trading style:
As #EURCAD approaches the red circle zone, I will be looking for bearish reversal setups (like a double top pattern, trendline break , and so on...)
📚 Always follow your trading plan regarding entry, risk management, and trade management.
Good luck!
All Strategies Are Good; If Managed Properly!
~Rich
Disclosure: I am part of Trade Nation's Influencer program and receive a monthly fee for using their TradingView charts in my analysis.

EUR/CAD Bears are getting strongerHI Traders.
I think when we develop more LTF correction there is a good chance that we will at least reach the buttom of the structure. I havent entered the posiition yet because i was already envolved in a EUR PAIR. But this is running in profit so i consider to enter one more when the setups plays out.

Sell eurcadStrongly sell expected from this marked area
Monthly and weekly overbought pair
Ready for the bearish correction now
Daily and weekly trend breaks and retested
Long Eurcad Long Eurcad but close it before weekly candle closes today. You don't necessarily have to wait till take profit. You can start taking profits after 30pips

EurCAD LongWe are at key area. At the support. We are looking to buy to the level as shown. We hope to get1:2 Return

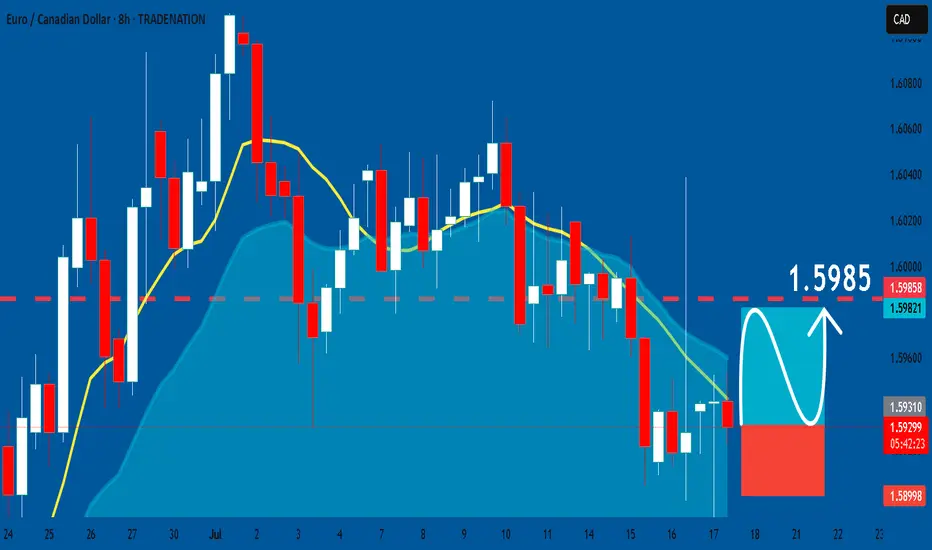
EURCAD: Long Signal with Entry/SL/TP
EURCAD
- Classic bullish pattern
- Our team expects retracement
SUGGESTED TRADE:
Swing Trade
Buy EURCAD
Entry - 1.5929
Stop - 1.5899
Take - 1.5985
Our Risk - 1%
Start protection of your profits from lower levels
Disclosure: I am part of Trade Nation's Influencer program and receive a monthly fee for using their TradingView charts in my analysis.
❤️ Please, support our work with like & comment! ❤️

EURCAD ShortEURCAD is now net short on the regression break.
I am considering my options on this pair. (EA with limited risk)
EUR_CAD GROWTH AHEAD|LONG|
✅EUR_CAD went down to retest
A horizontal support of 1.5964
Which makes me locally bullish biased
And I think that a move up
From the level is to be expected
Towards the target above at 1.6040
LONG🚀
✅Like and subscribe to never miss a new idea!✅
Disclosure: I am part of Trade Nation's Influencer program and receive a monthly fee for using their TradingView charts in my analysis.


EURCAD Will Grow! Long!
Please, check our technical outlook for EURCAD.
Time Frame: 1D
Current Trend: Bullish
Sentiment: Oversold (based on 7-period RSI)
Forecast: Bullish
The price is testing a key support 1.603.
Current market trend & oversold RSI makes me think that buyers will push the price. I will anticipate a bullish movement at least to 1.623 level.
P.S
We determine oversold/overbought condition with RSI indicator.
When it drops below 30 - the market is considered to be oversold.
When it bounces above 70 - the market is considered to be overbought.
Disclosure: I am part of Trade Nation's Influencer program and receive a monthly fee for using their TradingView charts in my analysis.
Like and subscribe and comment my ideas if you enjoy them!

Continuation PatternWe might see this continuation pattern push us to the above POI where we will see this pair start to fall

EURCAD Short Trade OANDA:EURCAD Short trade, with my back testing of this strategy, it hits multiple possible take profits, manage your position accordingly.
This is good trade, don't overload your risk like greedy, be disciplined trader, this is good trade.
Use proper risk management
Looks like good trade.
Lets monitor.
Use proper risk management.
Disclaimer: only idea, not advice

EURCAD DISCLAIMER: I am not a financial adviser. those videos and posts on my channel are for educational and entertainment purposes ONLY. I'm documenting my trading journey so that you have the potential to take ideas and inspiration from the videos that may help you within your own journey. But remember, trading/investing of any kind involves risk. Your trading/investments are solely your responsibility .

SELL EURCAD for bullish divergence trend reversal STOP LOSS: 1.6SELL EURCAD for bullish divergence trend reversal STOP LOSS: 1.6048
Regular Bearish Divergence
In case of Regular Bearish Divergence:
* The Indicator shows Lower Highs
* Actual Market Price shows Higher Highs
We can see a strong divergence on the MACD already and There is a strong trend reversal on the daily time frame chart.....
The daily time frame is showing strength of trend reversal from this level resistance so we are looking for the trend reversal and correction push from here .....
TAKE PROFIT: take profit will be when the trend comes to an end, feel from to send me a direct DM if you have any question about take profit or anything
Remember to risk only what you are comfortable with........trading with the trend, patient and good risk management is the key to success here

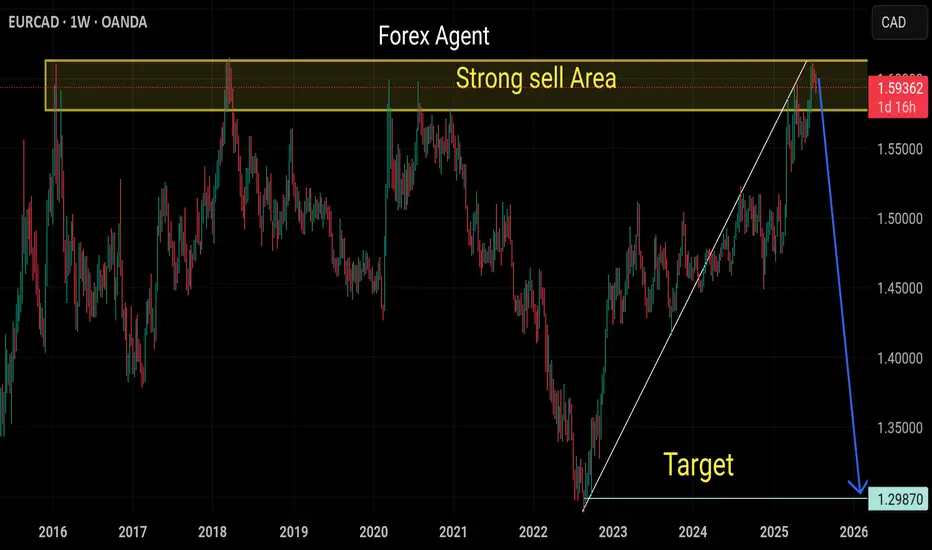
EURCAD – Over a Decade of Rejections Finally Breaking the Cycle?EURCAD is once again testing the legendary multi-year resistance between 1.60 and 1.6150, a zone that has caused at least 5 major rejections since 2014. Each of those led to significant drawdowns — yet this time, price is pressing deeper into it, potentially signaling a macro regime shift if bulls follow through.
Key Technical Observations
Timeframe: 1W
“Multi-Year Supply Zone” or “Overhead Resistance Zone”: 1.60 – 1.6150
Historical Reaction Dates:
🔸 17 Mar 2014
🔸 18 Jan 2016
🔸 19 Mar 2018
🔸 16 Mar 2020
🔸 27 Jul 2020
Current Candle (30 Jun 2025):
Pierced the zone briefly — now hovering just inside
Volume: Noticeable uptick in the last few weeks — interest is real
Structure Below: Strong accumulation base breakout around 1.5280, serving as major support now
TLDR
EURCAD is testing a monster historical supply zone (1.60–1.6150) for the 6th time in 11 years. This could be the breakout that changes the macro trend, but without confirmation, it's still a zone to respect.
Disclaimer
This is for educational purposes only. Not financial advice.
