YOU MUST BE A CONFLUENCE FINDER, let me explain.......All the information you need to find a high probability trade are in front of you on the charts so build your trading decisions on 'the facts' of the chart NOT what you think or what you want to happen or even what you heard will happen. If you have enough facts telling you to trade in a certain direction and therefore enough confluence to take a trade, then this is how you will gain consistency in you trading and build confidence. Check out my trade idea!!
www.tradingview.com
EURCAD trade ideas


EURCADWEEKLY is bullish, I'm expecting the continuation if price breaks above the bearish candles and gives us a bullish OB. Then we can buy back to the weekly high. confirmation is waiting for the 4h bullish OB to form.

EURCAD: Bullish Forecast & Bullish Scenario
The price of EURCAD will most likely increase soon enough, due to the demand beginning to exceed supply which we can see by looking at the chart of the pair.
Disclosure: I am part of Trade Nation's Influencer program and receive a monthly fee for using their TradingView charts in my analysis.
❤️ Please, support our work with like & comment! ❤️
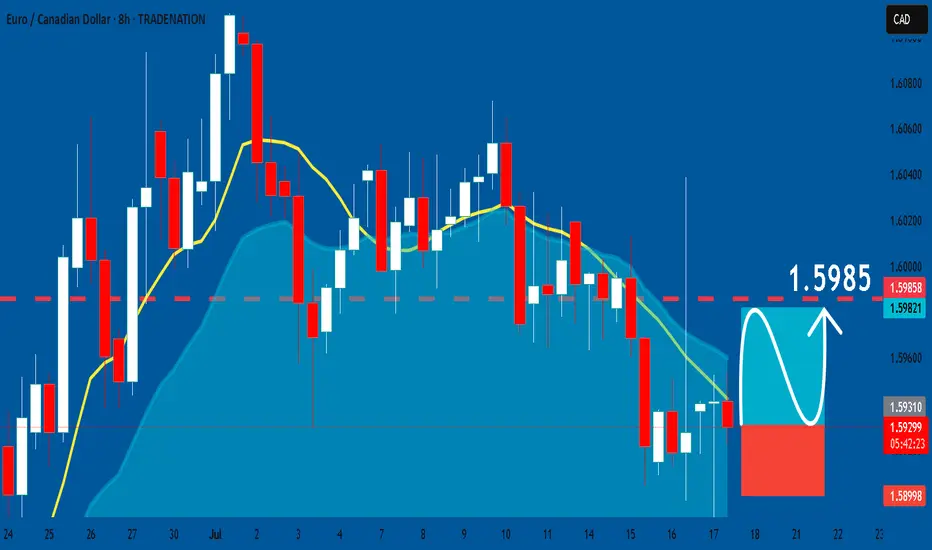
EURCAD: Long Signal with Entry/SL/TP
EURCAD
- Classic bullish pattern
- Our team expects retracement
SUGGESTED TRADE:
Swing Trade
Buy EURCAD
Entry - 1.5929
Stop - 1.5899
Take - 1.5985
Our Risk - 1%
Start protection of your profits from lower levels
Disclosure: I am part of Trade Nation's Influencer program and receive a monthly fee for using their TradingView charts in my analysis.
❤️ Please, support our work with like & comment! ❤️
EurCAD LongWe are at key area. At the support. We are looking to buy to the level as shown. We hope to get1:2 Return

EURCAD ShortEURCAD is now net short on the regression break.
I am considering my options on this pair. (EA with limited risk)

EURCAD Breakdown and Retest , All Eyes on SellingHello Traders
In This Chart EURCAD HOURLY Forex Forecast By FOREX PLANET
today EURCAD analysis 👆
🟢This Chart includes_ (EURCAD market update)
🟢What is The Next Opportunity on EURCAD Market
🟢how to Enter to the Valid Entry With Assurance Profit
This CHART is For Trader's that Want to Improve Their Technical Analysis Skills and Their Trading By Understanding How To Analyze The Market Using Multiple Timeframes and Understanding The Bigger Picture on the Charts

EURCAD BUYS!Both entries still very much valid, we are bullish on the daily , first entry pushes to the upside to take out liquidity , then we target the imbalance in the market at the bottom, which then pushes the market to break our last daily high.

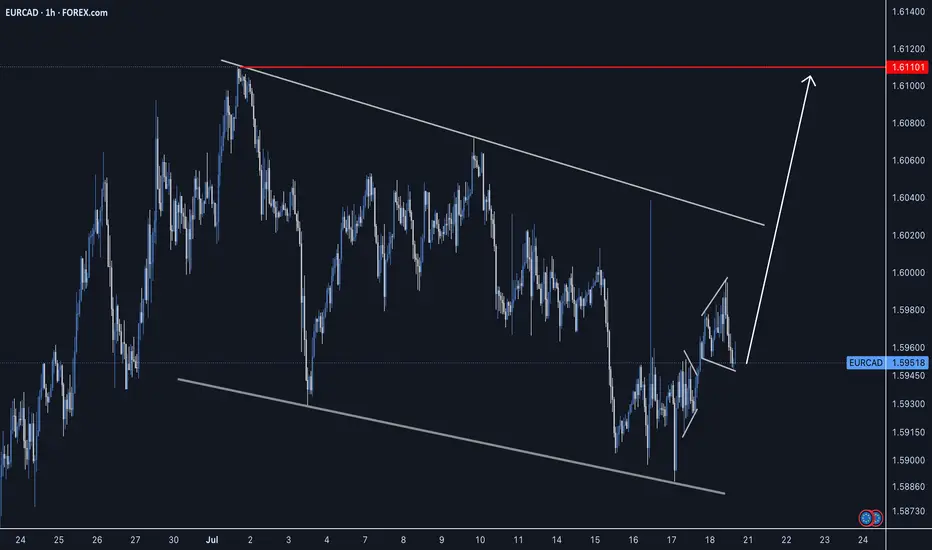
EUR_CAD LOCAL SHORT|
✅EUR_CAD is going up to retest
A horizontal resistance of 1.6110
Which makes me locally bearish biased
And I think that we will see a pullback
And a move down from the level
Towards the target below at 1.6077
SHORT🔥
✅Like and subscribe to never miss a new idea!✅
Disclosure: I am part of Trade Nation's Influencer program and receive a monthly fee for using their TradingView charts in my analysis.

EUR-CAD Risky Short! Sell!
Hello,Traders!
EUR-CAD is trading in a
Strong uptrend so we are
Bullish biased long-term
However a strong horizontal
Resistance is ahead at 1.6110
And the pair is overbought
So after the retest of the
Resistance we will be
Expecting a bearish correction
Sell!
Comment and subscribe to help us grow!
Check out other forecasts below too!
Disclosure: I am part of Trade Nation's Influencer program and receive a monthly fee for using their TradingView charts in my analysis.

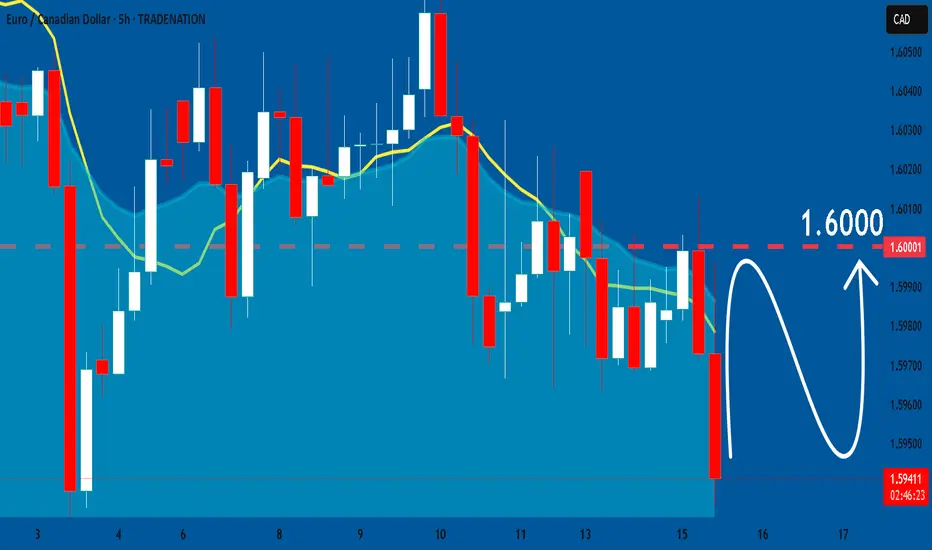
EUR/CAD BULLISH BIAS RIGHT NOW| LONG
Hello, Friends!
Previous week’s red candle means that for us the EUR/CAD pair is in the downtrend. And the current movement leg was also down but the support line will be hit soon and lower BB band proximity will signal an oversold condition so we will go for a counter-trend long trade with the target being at 1.600.
Disclosure: I am part of Trade Nation's Influencer program and receive a monthly fee for using their TradingView charts in my analysis.
✅LIKE AND COMMENT MY IDEAS✅

Eurcad buyEurcad is looking like testing my dynamic support zone and a possible push back up is looming to next level upwards. 1.60407 for the next retest of resistance.

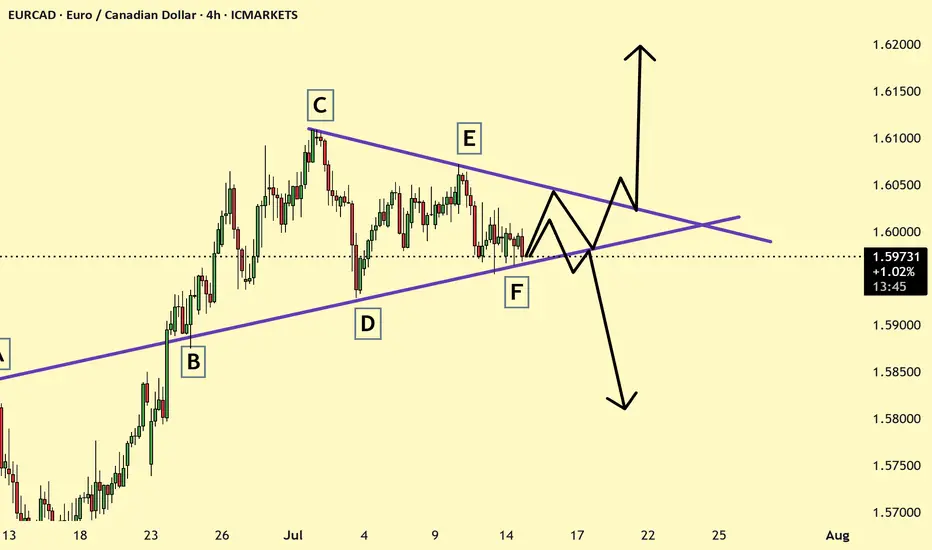
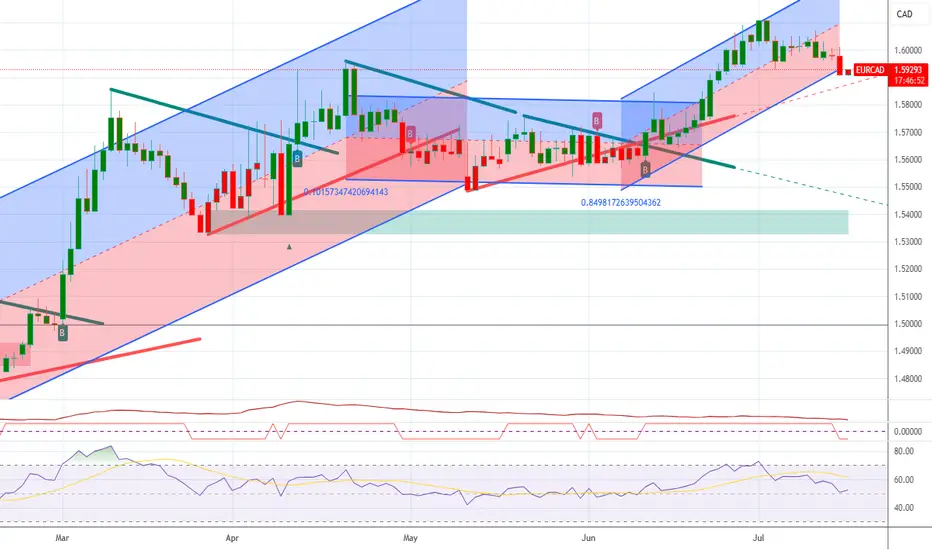
EUR/CAD make a fakeout and will soon decide its next trend.EURCAD recently made a faekout at the marked candle.
The candlestick pattern we can see is a Shooting Star. Yes, it does have a small wick at the bottom, but more or less looks like a Shooting Star.
After that, it fell right back into the channel. It's good to see that the channel is being respected.
Now, there's two possibilities that we're looking at for a trade.
Firstly, if we look at the Top Red trendline and the Green Trendline, we can see that there is a triangle formation. The price will decide if it wants to stay in the channel or not depending on how it reacts at the end of that triangle.
Next thing we look at is (assuming price respects the channel and continues down) that the price will start respect the big channel (Top Red trendline and Bottom Red Trendline) as it has been doing for a while now...
It's time to wait now and understand where price is going. In both possibilities, we have a trade which can be taken, but we must ensure that we have our rules and confluences in check before taking the trade.

Trade idea for EURCADThe sell-side liquidity at 1.58972 was purged, and now we target the buy-side liquidity at 1.60384. The potential entry zone is from CMP at 1.60016 with a stop loss at 1.59922. The 5-minute entry was taken based on the CISD strategy. Note the 1.59973 level; if this level is swept and not run through, then we can add more positions and maintain the same stop loss for larger rewards.

"EUR/CAD Price Pirate Mode: Long Entries Loading!"🔥🚨 "EUR/CAD BANK HEIST: The Ultimate Bullish Loot Grab! (Thief Trading Style) 🚨🔥
🌟 Greetings, Market Pirates & Profit Raiders! 🌟
(Hola! Oi! Bonjour! Hallo! Marhaba!)
The EUR/CAD "Euro vs Loonie" vault is WIDE OPEN—time to execute the Thief Trading Heist Plan! 🏦💰 Based on 🔥 high-probability technicals & stealthy fundamental analysis 🔥, here’s how we SWIPE THE LOOT before the bears catch on!
🎯 TRADE SETUP (Scalping/Day Heist)
📈 Entry (Bullish Raid):
"The vault door is cracked—enter anywhere!"
Pro Thief Move: Use buy limit orders near swing lows (15M/30M) for sneaky pullback entries.
Advanced Raid Tactics: Layer entries (DCA-style) for maximum loot efficiency.
🛑 Stop Loss (Escape Route):
Swing Low (4H) = 1.58800 (Adjust based on your risk tolerance & lot size!)
Thieves’ Golden Rule: "No heist is worth a jail sentence!" 🚔💨
🎯 Take Profit (Escape Before the Cops Arrive!):
Primary Target: 1.62300 (or exit early if resistance gets too hot!)
⚠️ Danger Zone: High-voltage resistance = Bear Trap Territory! ⚡🐻
💡 WHY THIS HEIST WILL WORK:
✅ Bullish Momentum Intact (Price structure favors buyers)
✅ Weak CAD Fundamentals (Loonie under pressure)
✅ Smart Money Algos Likely Pushing Higher (COT data hints at institutional bias)
📰 NEWS ALERT (Avoid the Market Police!)
🚨 Upcoming High-Impact Events?
Avoid new trades during news spikes!
Trailing stops = Your getaway car! 🚗💨
💥 BOOST THIS HEIST! (Let’s Get RICH Together!)
🔥 Hit the 👍 LIKE & 🚀 BOOST button to strengthen our robbery squad!
💬 Comment your entry & TP—let’s track the loot!
🔔 Follow for DAILY HEIST PLANS!
⚠️ DISCLAIMER (Stay Out of Jail!):
This is NOT financial advice—just a pirate’s treasure map! 🗺️
Manage risk like a pro thief—don’t blow your capital!
🚀 Ready to RAID? Let’s STEAL those pips! 🏴☠️💸

EURCAD - Long Setup - Impulse, Correction, ImpulsePrice action has been setting up for the next impulse phase as we can the bullish continuation is completing to indicate price has further growth. Looking for a long entry this upcoming week.
Good Luck
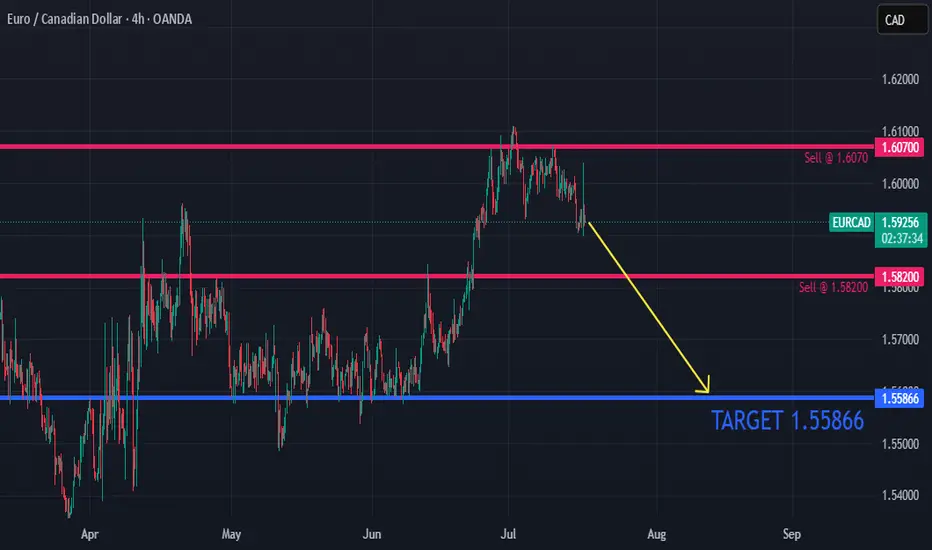
EURCAD – Two Key Levels, One Solid PlanOn this pair, we have two important levels:
🟡 The first level might act as a trap (stop hunting).
So don’t rush to buy — wait for confirmation.
🟢 The second level offers a safer buy opportunity.
As always, our plan stays firm —
we don’t tell the market what to do, we follow it.
🔻 If a clean break and valid pullback occurs on the first level,
a short trade toward the lower level is possible.
⚠️ This pullback short scenario is only valid until price reaches the lower level.
If price hits the lower level and starts moving up,
any short position becomes much riskier.
Discipline > Prediction.

Trends Report#1:Learn How To See Bullish Chart Patterns It's been a wild week.As I am strategy building.
So far I have about 3 solid trading strategies.
Then I have two more pending to learn more.
My dream as a man has always been to learn how to make money.
Staying in the financial markets because I went to college to study information and technology.
In my academic studies there was nothing close to what I learned on trading.
Financial technology software development is what I have decided to study as an academic pursue.
The education system is broken.
Look at this chart.
☝️The price is above the 50 EMA
☝️The price is above the 200 EMA
☝️The price has reversed on a Bullish Harami Candlestick pattern .
This reversal is confirmed by both the positive volume + volume oscillating tool.
To learn more 🚀 Boost This Content
Disclaimer ⚠️ Trading is risky please learn Risk Management And Profit Taking Strategies.Also feel free to use a simulation trading account before you use real money.

EURCAD possible ScenarioEURCAD is trading in triangle channel pattern and is at the support and wait for possible breakdown or barkeout? and trade accordingly.