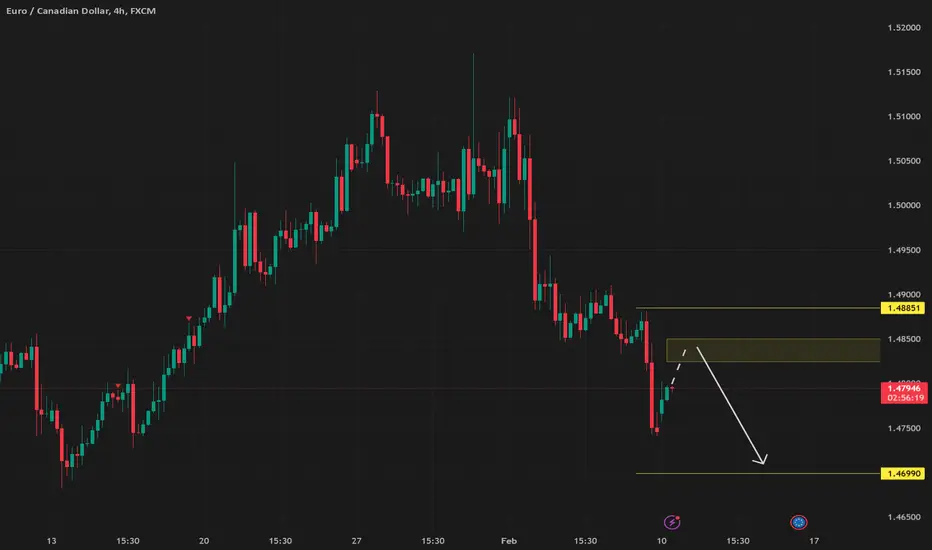
Bearish drop?EUR/CAD has reacted off the resistance level which is a pullback resistance and could drop from this level to our take profit.
Entry: 1.4800
Why we like it:
There is a pullback resistance level.
Stop loss: 1.4847
Why we like it:
There is a pullback resistance level.
Take profit: 1.4682
Why we like it:
There is a pullback support level.
Enjoying your TradingView experience? Review us!
Please be advised that the information presented on TradingView is provided to Vantage (‘Vantage Global Limited’, ‘we’) by a third-party provider (‘Everest Fortune Group’). Please be reminded that you are solely responsible for the trading decisions on your account. There is a very high degree of risk involved in trading. Any information and/or content is intended entirely for research, educational and informational purposes only and does not constitute investment or consultation advice or investment strategy. The information is not tailored to the investment needs of any specific person and therefore does not involve a consideration of any of the investment objectives, financial situation or needs of any viewer that may receive it. Kindly also note that past performance is not a reliable indicator of future results. Actual results may differ materially from those anticipated in forward-looking or past performance statements. We assume no liability as to the accuracy or completeness of any of the information and/or content provided herein and the Company cannot be held responsible for any omission, mistake nor for any loss or damage including without limitation to any loss of profit which may arise from reliance on any information supplied by Everest Fortune Group.
EURCAD trade ideas

EURCADIf show as confirmation at the supply zone we take it short just for scalp to the H4 supply zone
LR

EURCAD Short from Premium Zone🔴 Type: Intraday Reversal Short
✅ Entry Zone: 1.4825-1.4850 (Bearish OB + Liquidity Pool).
✅ Stop Loss: 1.4875 (Above Institutional Order Block).
✅ Take Profits:
🎯 TP1: 1.4790 (First rejection point).
🎯 TP2: 1.4750 (Liquidity Grab Retest).
🎯 TP3: 1.4700 (Deeper Discount Zone).
✅ Confidence Level: HIGH (Multiple Smart Money Confluences).
📌 Execution Strategy:
✔ Wait for price to retrace into 1.4825-1.4850 zone.
✔ Look for rejection (bearish engulfing / wick rejections).
✔ Enter aggressively OR use a pending limit order.

EURCAD - Short EURCAD has formed bearish divergence with double top reversal pattern.
LH and LL is formed.
Entry is at retracement at next LH.

EURCAD about to drop for more than 400 pips!Based on my quantum algorithms EURCAD will drop for 400+ pips


EURCADOn Friday, February 7, 2025, Canada released employment data showing:
Employment Change: An increase of 76.0K jobs, significantly exceeding the forecast of 25.5K and lower than the previous 90.9K.
Unemployment Rate: A decrease to 6.6%, better than the forecast of 6.8% and the previous 6.7%.
Impact on EUR/CAD in the Coming Weeks:
Bearish Candle Close: The week closing with a red bearish candle suggests initial selling pressure.
Positive Canadian Data: The better-than-expected Canadian employment data could strengthen the CAD, potentially pushing EUR/CAD lower. A cooling economy could weaken the CAD.
Technical Analysis: Technical analysis suggests a bullish to bearish outlook because we have a break out of monthly descending trend line and as well as break of monthly demand floor which could see more drop in EURCAD before rally in price..so we have a case of 50/50 ,be cautious.
EUR/CAD Trade Directional Bias:
Bearish Bias: Given the positive Canadian employment data, which is likely to strengthen the Canadian dollar, there could be a bearish bias for EUR/CAD in the coming weeks. Look for potential support and buy but keep in mind of the weekly bearish candle closed on on break of structure.
Other Economic Data Prints Affecting EUR/CAD Direction:
Eurozone Data: German ZEW Economic Sentiment and the broader ZEW Economic Sentiment for the Eurozone, which are indicators of investor sentiment and economic expectations, might impact the EURCAD.
US Economic Data: Disappointing economic data and uncertainty around Federal Reserve policies in the U.S. may impact the EURCAD.
Bank of Canada (BOC) Decisions: Keep an eye on the Bank of Canada's (BOC) interest rate decisions by Tiff Macklem who is the current Governor of the Bank of Canada.
Crude Oil Prices: The decline of crude oil prices may impact the Canadian dollar.
US Senate Confirmation: US retail sales headline economic data may impact EURCAD.
US Interest Rates and Yield Spreads: US interest rates and yield spreads may impact EURCAD
Disclaimer: This analysis is for informational purposes only and does not constitute investment advice.
Trade at your own risk ,and apply proper risk management.

EURCAD: Bullish Continuation is Highly Probable! Here is Why:
Balance of buyers and sellers on the EURCAD pair, that is best felt when all the timeframes are analyzed properly is shifting in favor of the buyers, therefore is it only natural that we go long on the pair.
❤️ Please, support our work with like & comment! ❤️

Buy eurcadHere the detailed structure of eurcad
Trading in a parallel buy channel
Failed to pump in sell side
More buy expected to sweep high


EUR-CAD Will Soon Retest A Support! Buy!
Hello,Traders!
EUR-CAD is falling down
And is locally oversold
So after the price hits
A horizontal support
Of 1.4684 from where
A local bullish rebound
Is to be expected
Buy!
Comment and subscribe to help us grow!
Check out other forecasts below too!

EURCAD Will Grow! Buy!
Take a look at our analysis for EURCAD.
Time Frame: 1h
Current Trend: Bullish
Sentiment: Oversold (based on 7-period RSI)
Forecast: Bullish
The market is trading around a solid horizontal structure 1.476.
The above observations make me that the market will inevitably achieve 1.480 level.
P.S
We determine oversold/overbought condition with RSI indicator.
When it drops below 30 - the market is considered to be oversold.
When it bounces above 70 - the market is considered to be overbought.
Like and subscribe and comment my ideas if you enjoy them!

EUR_CAD MOVE UP AHEAD|LONG|
✅EUR_CAD will soon retest a key support level of 1.4685
So I think that the pair will make a rebound
And go up to retest the supply level above at 1.4810
LONG🚀
✅Like and subscribe to never miss a new idea!✅

EURCAD - Bearish Double TOPHello Traders !
The EURCAD price formed a double top pattern.
Currently, The neckline is broken !
So, I expect a bearish move📉
______________
TARGET: 1.47880🎯

EURCAD Expected Growth! BUY!
My dear friends,
EURCAD looks like it will make a good move, and here are the details:
The market is trading on 1.4823 pivot level.
Bias - Bullish
Technical Indicators: Supper Trend generates a clear long signal while Pivot Point HL is currently determining the overall Bullish trend of the market.
Goal - 1.4906
Recommended Stop Loss - 1.4770
About Used Indicators:
Pivot points are a great way to identify areas of support and resistance, but they work best when combined with other kinds of technical analysis
———————————
WISH YOU ALL LUCK

EURCAD 06/02/2025Weekly:
-Weekly highs rejected.
Daily:
-Bearish W pattern.
-H&S pattern.
-IC.
4H:
-Bearish W pattern.

EURCAD BULLISH FOR 100PIPSTechnical Analysis:
Chart Patterns: A bullish pattern like an ascending triangle, bullish flag, or double bottom could suggest that EUR/CAD is poised for an upward movement.
Support and Resistance: If the pair has recently bounced off a key support level and is approaching resistance, breaking through resistance could result in a 100-pip rise.
Moving Averages: If short-term moving averages (like the 50-period MA) cross above longer-term moving averages (like the 200-period MA), it could signal bullish momentum.
Indicators: Bullish indicators such as the Relative Strength Index (RSI) or Moving Average Convergence Divergence (MACD) might also show a potential upward move.
2. Fundamental Factors:
Eurozone Economic Data: Positive economic data from the Eurozone (such as GDP growth, employment figures, or inflation reports) could strengthen the Euro.
Canadian Economic Data: Weakness in Canadian economic indicators (like poor GDP growth, falling oil prices, or weak inflation) could lead to the Canadian Dollar weakening.
Interest Rate Differentials: If the European Central Bank (ECB) is expected to raise interest rates or signals tighter monetary policy while the Bank of Canada (BoC) remains dovish or cuts rates, the Euro could strengthen relative to the Canadian Dollar.
3. Sentiment & News:
Risk Appetite: A positive shift in market sentiment (risk-on) might lead traders to buy the Euro as the Eurozone economy may be perceived as stable, especially if the CAD is correlated with commodities like oil.
Geopolitical Events: News events affecting the Canadian economy (like a natural disaster or a disruption in oil production) might cause a temporary decline in the Canadian Dollar.

eurcad sell tradeThe Relative Strength Index (RSI) is showing a downward trend, indicating weakening momentum. Additionally, the Moving Average Convergence Divergence (MACD) is showing a bearish crossover, further supporting the potential for a downward move


EURCAD The Target Is UP! BUY!
My dear subscribers,
This is my opinion on the EURCAD next move:
The instrument tests an important psychological level 1.4882
Bias - Bullish
Technical Indicators: Supper Trend gives a precise Bullish signal, while Pivot Point HL predicts price changes and potential reversals in the market.
Target - 1.4964
About Used Indicators:
On the subsequent day, trading above the pivot point is thought to indicate ongoing bullish sentiment, while trading below the pivot point indicates bearish sentiment.
———————————
WISH YOU ALL LUCK

EUR/CAD BULLS ARE STRONG HERE|LONG
Hello, Friends!
EUR/CAD is making a bearish pullback on the 10H TF and is nearing the support line below while we are generally bullish biased on the pair due to our previous 1W candle analysis, thus making a trend-following long a good option for us with the target being the 1.496 level.
✅LIKE AND COMMENT MY IDEAS✅

EURCAD Aggressive Trade with Potential for Huge GainsI'll keep this short and to the point -
Technical Outlook:
Price recently hit a ceiling which has historically served as resistance (1.51750) , however we have been in an uptrend since late 2022. In Nov 2024 we saw bulls rally at strong levels of demand and continued to drive price upwards, creating a demand feed which price reacted off more recently (as shown on the chart).
Once price reached the ceiling level, it took a nose dive UNTIL we saw it decelerate at the latest demand feed, which could potentially have a trove of resting orders ready to be filled.
Trading Considerations:
I will be keeping an eye on the 15m chart during London and NY sessions for bullish momentum to take hold. As it stands right now, a break above 1.49050 would be early signs to get involved. This can always change as new structure is formed on the LTF's but we are deep in discount territory. Watch for liquidity build up and volume to understand which LTF demand levels could hold during high volume sessions.
Final Notes:
As added confluence, this pair is currently oversold on the RSI.
While navigating the LTF's make sure to adapt to changing conditions.
Again, this is another trade which could potentially turn into a swing position (provided demand holds, we could see an upward move that finally breaks the ceiling).
While the Euro continues to weaken against the USD, the Loonie should be able hold its own during this ongoing trade war (based on the fact that they've not just rolled over and do have some fight in them).
We get to witness these scary times unfold - and it makes trading that much more exciting!
Happy hunting predators!
Apex out!
OANDA:EURCAD FX:EURUSD OANDA:USDCAD
