EUR/CAD Daily AnalysisPrice has shown a strong rejection of 1.5150 which has acted as a sell zone on numerous occasions last year.
Ideally we will get a pullback towards the big number 1.50 to 1.5040 and a rejection.
Final targets could be at the bottom of the zone at 1.4550
EURCAD trade ideas

EURCAD REVERSALTechnically:
EURCAD printing double top
EURCAD printing bearish divergence
EURCAD break double top neckline when it retrace again we take entry
Fundamentally:
According COT data
EXY is bearish
CXY is bullish

EURCAD Resistance , All eyes on SellingHello Traders
In This Chart EURCAD HOURLY Forex Forecast By FOREX PLANET
today EURCAD analysis 👆
🟢This Chart includes_ (EURCAD market update)
🟢What is The Next Opportunity on EURCAD Market
🟢how to Enter to the Valid Entry With Assurance Profit
This CHART is For Trader's that Want to Improve Their Technical Analysis Skills and Their Trading By Understanding How To Analyze The Market Using Multiple Timeframes and Understanding The Bigger Picture on the Charts

1:2 RR made on EURCAD, but now what? I was hoping for more... The CAD fundamentals are very poor, and inflation is currently under control, so the Bank of Canada may continue to cut rates.
I'm not keen on buying the EUR. However, this trade is based on CAD weakness and strong EURCAD price action, more than a stronger euro. But, hey, Euro Area inflation is climbing and above target, so the ECB's rate-cutting cycle may be over.
I want to go long again. OANDA:EURCAD is clearly up-trending within a bullish channel on the weekly. However, it is ranging and choppy on the daily. The 4-hour may become oversold, which may provide an opportunity.
I guess it's a waiting game...


EURCAD POSSIBLE BUY OPPORTUNITY!Price is has a good probability to bounce off around the area of 1.48422 For a bullish price continuation. A buy opportunity is envisaged from that price level.

EURCAD_4HEURCAD_4H BULLISH
Everything is mentioned on Charts.
Please always look for double confirmation before entry.
Wish you Happy & safe Trading.
Trade as per your own RISK
Please Note:
My studies are for educational purpose only.
Please consult your financial advisor before Trading or Investing.
I'm not responsible for any kinds of your Profits & Losses.

EURCAD: Trump Trade - Short Europe Vs CanadaFundamentals:
Canada looks better as it could settle some solution with Trump
Europe can't politically and economically agree on buying US cars and agriculture
Technicals:
EURCAD is in the range between 1.5113 and 1.4283 and hit the top of it recently.
Hence, odds are in favor of sell supporting fundamentals above.
Trade setup:
Short current (1.4907)
Stop 1.5301
Take profit 1.4283 (anywhere below 1.44)

Bearish drop?EUR/CAD is reacting off the pivot which has been identified as an overlap support and could drop to the pullback support.
Pivot: 1.49218
1st Support: 1.47989
1st Resistance: 1.50755
Risk Warning:
Trading Forex and CFDs carries a high level of risk to your capital and you should only trade with money you can afford to lose. Trading Forex and CFDs may not be suitable for all investors, so please ensure that you fully understand the risks involved and seek independent advice if necessary.
Disclaimer:
The above opinions given constitute general market commentary, and do not constitute the opinion or advice of IC Markets or any form of personal or investment advice.
Any opinions, news, research, analyses, prices, other information, or links to third-party sites contained on this website are provided on an "as-is" basis, are intended only to be informative, is not an advice nor a recommendation, nor research, or a record of our trading prices, or an offer of, or solicitation for a transaction in any financial instrument and thus should not be treated as such. The information provided does not involve any specific investment objectives, financial situation and needs of any specific person who may receive it. Please be aware, that past performance is not a reliable indicator of future performance and/or results. Past Performance or Forward-looking scenarios based upon the reasonable beliefs of the third-party provider are not a guarantee of future performance. Actual results may differ materially from those anticipated in forward-looking or past performance statements. IC Markets makes no representation or warranty and assumes no liability as to the accuracy or completeness of the information provided, nor any loss arising from any investment based on a recommendation, forecast or any information supplied by any third-party.

EURCAD - Sell Setup at Clear Resistance ZoneOANDA:EURCAD is approaching a significant resistance zone. This zone has consistently acted as a key area of interest where sellers regained control, leading to reversals. If the price confirms rejection through bearish price action, such as wicks signaling rejection, I anticipate a move downward toward the 1.49600 level.
However, if the price successfully breaks and holds above the zone, this would invalidate the bearish outlook and could open the door for further upside.
Proper risk management is essential, given the possibility of price breaking higher.
This is not financial advice but rather how I approach support/resistance zones. Always wait for confirmation, like a rejection candle or volume spike before jumping in. And let me know what you think of this setup in the comments!

EURCADThe EURCAD pair is near a supply zone on the 60-minute chart, signaling a potential sell opportunity. Look for bearish candlestick patterns to confirm entry.

Falling towards 50% Fibonacci support?EUR/CAD is falling towards the support level which is an overlap support that aligns with the 50% Fibonacci retracement and could bounce from this level to our take profit.
Entry: 1.4922
Why we like it:
There is an overlap support level that lines up with the 50% Fibonacci retracement.
Stop loss: 1.4840
Why we like it:
There is a pullback support level that is slightly above the 71% Fibonacci retracement.
Take profit: 1.5067
Why we like it:
There is a pullback resistance.
Enjoying your TradingView experience? Review us!
Please be advised that the information presented on TradingView is provided to Vantage (‘Vantage Global Limited’, ‘we’) by a third-party provider (‘Everest Fortune Group’). Please be reminded that you are solely responsible for the trading decisions on your account. There is a very high degree of risk involved in trading. Any information and/or content is intended entirely for research, educational and informational purposes only and does not constitute investment or consultation advice or investment strategy. The information is not tailored to the investment needs of any specific person and therefore does not involve a consideration of any of the investment objectives, financial situation or needs of any viewer that may receive it. Kindly also note that past performance is not a reliable indicator of future results. Actual results may differ materially from those anticipated in forward-looking or past performance statements. We assume no liability as to the accuracy or completeness of any of the information and/or content provided herein and the Company cannot be held responsible for any omission, mistake nor for any loss or damage including without limitation to any loss of profit which may arise from reliance on any information supplied by Everest Fortune Group.

EURCAD: Bearish Continuation & Short Signal
EURCAD
- Classic bearish pattern
- Our team expects retracement
SUGGESTED TRADE:
Swing Trade
Sell EURCAD
Entry - 1.5063
Stop - 1.5120
Take - 1.4959
Our Risk - 1%
Start protection of your profits from lower levels
❤️ Please, support our work with like & comment! ❤️


EURCAD - Long TradePrice is moving in bullish trend with no bearish divergence.
Entry is at retracement.
SL is below last HL.

BUY position we placed a buy position on the eurcad after noticing price action pattern formed
pattern included a head and shoulder pattern at the end of bearish move along with a fake break indicaitng reversal one is probable
please see what would happen
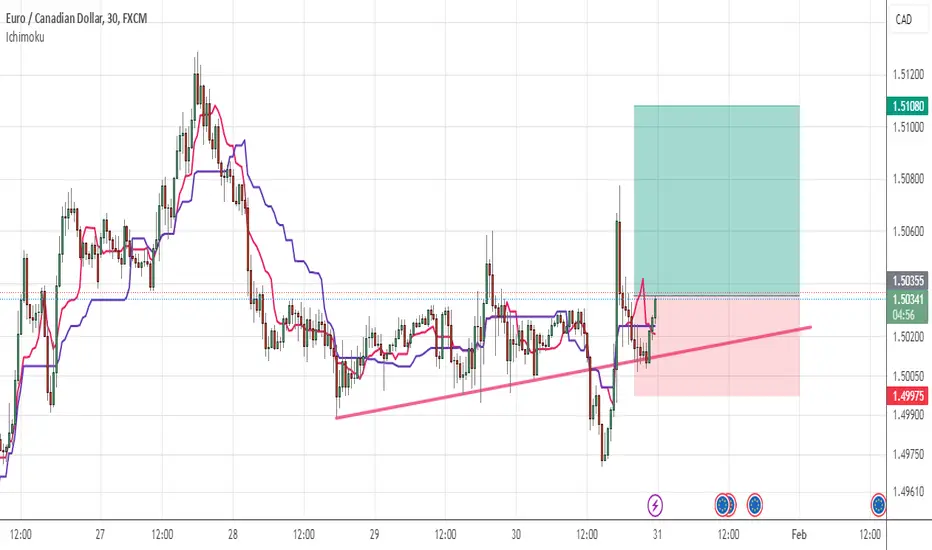
EURCAD - 28 Jan 2025 SetupEURCAD Market structure are making N pattern on the market structure with strong bullish rally. Spotted demand area (Green Rectangle). its a very good demand area structure after the price creating a higher high.
Entry Position : Long
Profit Target : 1:3 Shown on the chart image (Green Line)
Stop Loss : Slightly below demand area (Red Line)
Follow me if u guys making any gains from this idea.
Thanks
Coffee Trade Team

EURCAD BULLISH FOR 100PIPSTechnical Analysis: Look for key support and resistance levels, trend lines, and moving averages that might suggest the pair is in an uptrend. A break above recent resistance could signal a potential 100-pip move higher.
Economic Events: Key data releases or central bank decisions related to the Eurozone and Canada (like interest rate changes or GDP growth reports) could influence the EURCAD pair significantly.
Market Sentiment: Assess the overall market sentiment toward the Euro and Canadian Dollar. If the market is generally bullish on the Euro or bearish on the CAD (e.g., due to weak oil prices, which affect the CAD), the pair could see upward momentum.
Price Action: Monitor for bullish candlestick patterns such as bullish engulfing or pin bars around support levels, as these may signal a continuation of the bullish trend.


eurcad sell tradeThe Relative Strength Index (RSI) is showing a downward trend, indicating weakening momentum. Additionally, the Moving Average Convergence Divergence (MACD) is showing a bearish crossover, further supporting the potential for a downward move

EUR/CAD SHORT FROM RESISTANCE
Hello, Friends!
EUR/CAD pair is trading in a local uptrend which we know by looking at the previous 1W candle which is green. On the 1D timeframe the pair is going up too. The pair is overbought because the price is close to the upper band of the BB indicator. So we are looking to sell the pair with the upper BB line acting as resistance. The next target is 1.465 area.
✅LIKE AND COMMENT MY IDEAS✅

Bearish drop off 38.2% Fibonacci resistance?EUR/CAD is rising towards the pivot which has been identified as a pullback resistance and could drop to the overlap support.
Pivot: 1.50485
1st Support: 1.49224
1st Resistance: 1.51355
Risk Warning:
Trading Forex and CFDs carries a high level of risk to your capital and you should only trade with money you can afford to lose. Trading Forex and CFDs may not be suitable for all investors, so please ensure that you fully understand the risks involved and seek independent advice if necessary.
Disclaimer:
The above opinions given constitute general market commentary, and do not constitute the opinion or advice of IC Markets or any form of personal or investment advice.
Any opinions, news, research, analyses, prices, other information, or links to third-party sites contained on this website are provided on an "as-is" basis, are intended only to be informative, is not an advice nor a recommendation, nor research, or a record of our trading prices, or an offer of, or solicitation for a transaction in any financial instrument and thus should not be treated as such. The information provided does not involve any specific investment objectives, financial situation and needs of any specific person who may receive it. Please be aware, that past performance is not a reliable indicator of future performance and/or results. Past Performance or Forward-looking scenarios based upon the reasonable beliefs of the third-party provider are not a guarantee of future performance. Actual results may differ materially from those anticipated in forward-looking or past performance statements. IC Markets makes no representation or warranty and assumes no liability as to the accuracy or completeness of the information provided, nor any loss arising from any investment based on a recommendation, forecast or any information supplied by any third-party.

THIS FORECAST EURCAD FOR OVERNIGHT RATE LATERThis EURCAD FORECAST
Opportunity for EURCAD. This setup is my trading idea/plan, if you want to follow: trade at your own risk (TAYOR).
Risk Factors:
1. Market conditions, unexpected news, or external events could impact the trade.
2. Always use risk management strategies to protect your capital.
