EURCAD MAY RETEST ALL-TIME-HIGH AGAIN If you look at this very closely, you would see that the monthly candle of June 2025 already closed above June 2020 after 5 years exactly. That was very instructive. However, there may be opportunities for sell as counter trade as we are currently seeing some rejections that can be seen more clearly in lower timeframes.
Nevertheless, I am ultimately bullish and would be looking to buy to that 1.75 zone in the near-future, depending on the price action I am seeing on the daily.
Let us see if daily is in perfect alignment with the monthly.
Trade with caution!!!!
EURCAD trade ideas

Long Eurcad Long Eurcad but close it before weekly candle closes today. You don't necessarily have to wait till take profit. You can start taking profits after 30pips

EURCAD LONGBy utilizing Fibonacci retracement levels, historical patterns, , we can formulate a hypothesis that the market might follow a similar trajectory if bullish sentiment prevails.

EUR/CAD Bears are getting strongerHI Traders.
I think when we develop more LTF correction there is a good chance that we will at least reach the buttom of the structure. I havent entered the posiition yet because i was already envolved in a EUR PAIR. But this is running in profit so i consider to enter one more when the setups plays out.

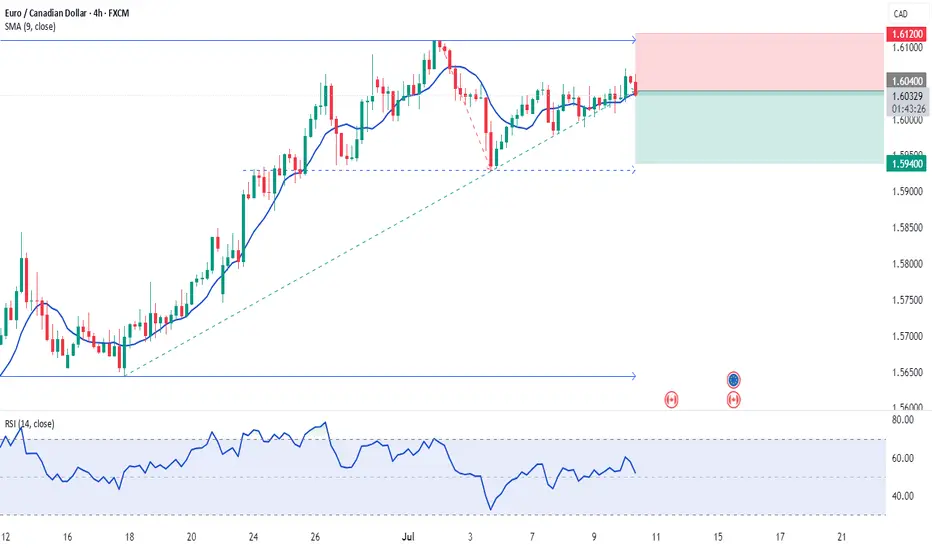
10.07.2025 #EURCADSELL 1.60400 | STOP 1.61200 | TAKE 1.59400 | Technical correctional price movement downwards to the local support level.
SELL EURCAD for bullish divergence trend reversal STOP LOSS: 1.6SELL EURCAD for bullish divergence trend reversal STOP LOSS: 1.6048
Regular Bearish Divergence
In case of Regular Bearish Divergence:
* The Indicator shows Lower Highs
* Actual Market Price shows Higher Highs
We can see a strong divergence on the MACD already and There is a strong trend reversal on the daily time frame chart.....
The daily time frame is showing strength of trend reversal from this level resistance so we are looking for the trend reversal and correction push from here .....
TAKE PROFIT: take profit will be when the trend comes to an end, feel from to send me a direct DM if you have any question about take profit or anything
Remember to risk only what you are comfortable with........trading with the trend, patient and good risk management is the key to success here

EURCAD DISCLAIMER: I am not a financial adviser. those videos and posts on my channel are for educational and entertainment purposes ONLY. I'm documenting my trading journey so that you have the potential to take ideas and inspiration from the videos that may help you within your own journey. But remember, trading/investing of any kind involves risk. Your trading/investments are solely your responsibility .

EURCAD Will Grow! Long!
Please, check our technical outlook for EURCAD.
Time Frame: 1D
Current Trend: Bullish
Sentiment: Oversold (based on 7-period RSI)
Forecast: Bullish
The price is testing a key support 1.603.
Current market trend & oversold RSI makes me think that buyers will push the price. I will anticipate a bullish movement at least to 1.623 level.
P.S
We determine oversold/overbought condition with RSI indicator.
When it drops below 30 - the market is considered to be oversold.
When it bounces above 70 - the market is considered to be overbought.
Disclosure: I am part of Trade Nation's Influencer program and receive a monthly fee for using their TradingView charts in my analysis.
Like and subscribe and comment my ideas if you enjoy them!

EURCAD - Long Bias explanation and Entry/SL/TP ideasThe main reasons this seems like a very good opportunity to me are :
Trend : EURCAD is in a strong uptrend at the moment
Retail : Majority have a BEARISH sentiment on this pair
Institutions : More holdings in EUR than CAD
Structures : Equal highs up above that MAY act as a magnet
Price action : Recent breakout of a consolidation and resistance shelf
Targets : levels at round numbers
Stops : Many options to place stops below
Entries : Many options in terms of entry aswell
This is primarily for me as a reference in the future.
For educational purposes only

EURCAD BUY TRADE PLAN ✅ EURCAD TRADE PLAN
📅 **Date**: July 10, 2025
🕐 **Pair**: EUR/CAD
---
### 1️⃣ STRUCTURAL ALIGNMENT
| TF | Structure Status | Key Levels | Market Bias |
| -- | ------------------- | ------------------------------ | ----------------- |
| D1 | Bullish Trend | HH: 1.6108 / HL: 1.5910 | ✅ Bullish |
| H4 | Trend Resumption | Range Break > 1.6060 Confirmed | ✅ Bullish |
| H1 | Micro Bullish Shift | Price > 1.6040 key minor HL | ✅ Bullish (Ready) |
🧠 **Comment**: Market holding higher low structure across all TFs. Compression breakout likely underway.
---
### 2️⃣ ENTRY TRIGGER ZONE
| Parameter | Level / Zone |
| --------------- | ---------------------------------- |
| 🎯 ENTRY | **1.6025–1.6038** (retest pocket) |
| ⛔ STOP LOSS | **1.5975** (below H1 invalidation) |
| 🎯 TP1 | **1.6100** (prev swing high) |
| 🎯 TP2 | **1.6170** (measured extension) |
| 🧠 Optional TP3 | **1.6235** (macro fib proj) |
📌 **Only enter on valid wick or LTF confirmation candle inside zone.**
📉 Avoid mid-candle chases or breakout impulse entries. Let it *pull back*.
---
### 3️⃣ RISK MODEL INTEGRITY
| Metric | Value |
| ------------------- | -------------------------------- |
| SL Distance | ≈ 50-60 pips max |
| Minimum RRR | **1:2.5 to 1:3.5** |
| Break-even Protocol | Lock BE after 1H close > 1.6080 |
| Trade Invalidation | 1H Close < 1.5975 |
⚠️ Risk size calibrated to avoid breach of core portfolio risk ceiling.
---
### 4️⃣ MACRO–FUNDAMENTAL ALIGNMENT
| Macro Driver | Current Stance | Effect |
| ----------------------- | ------------------------------------------------ | ------------------- |
| 🇨🇦 CAD | Weak (Oil pressure + BOC dovish bias) | ✅ CAD Soft |
| 🇪🇺 EUR | Strong (Post-NFP euro demand + ECB hawkish tone) | ✅ EUR Strong |
| Intermarket Correlation | Oil ↓ → CAD ↓ | ✅ Pro-EURCAD |
| Macro Bias | **EUR Strength > CAD Weakness** | ✅ Bullish Alignment |
🧠 No conflict with structural plan = ✅ Macro Confirmed
---
### 5️⃣ EXECUTION PROTOCOL
* 💎 *Type*: **Limit Order** ONLY — no market chasing
* 🎯 Wait for rejection or bullish engulfing on 15M or 30M inside entry zone
* 🔒 Trail after price > 1.6080 with hourly close
* ❌ Do not trade this setup if **1.5980 is breached intraday**
---
🚫 NOT INVESTMENT ADVICE – For institutional execution only under your risk model.

Continuation PatternWe might see this continuation pattern push us to the above POI where we will see this pair start to fall

Sell EURCADEURCAD will fall from this area 1,60444. 1000 pip decline towards 1,59444. Head and shoulders pattern confirms this move. Hedge, hold and have patience.

EURCAD: Strong Bullish PatternObserve the price movement on 📈EURCAD.
The next buying signal will occur with a bullish breakout above the neckline of an ascending triangle pattern on the 4-hour chart.
A 4-hour candle closing above 1.6056 will confirm this breakout, with the next resistance level at 1.6105.


Second buy entry..BUY EURCAD now for a four hour time frame bulBUY EURCAD now for a four hour time frame bullish trend continuation ...............
STOP LOSS: 1.5969
This buy trade setup is based on hidden bullish divergence trend continuation trading pattern ...
Always remember, the trend is your friend, so whenever you can get a signal that the trend will continue, then good for you to be part of it
TAKE PROFIT : take profit will be when the trend comes to an end, feel from to send me a direct DM if you have any question about take profit or anything...
Remember to risk only what you are comfortable with... trading with the trend, patient and good risk management is the key to success here

EURCAD positions for a buy! (Intraday opportunity) From what we see in H1 timeframe price is likely to trade bullish from the H1 support Level of 1.60071 technical analysis shows how price made a low at 1.59370 and a recent pullback at 1.59797 connecting the low and recent pullback gives us a nice trendline. a buy opportunity is envisaged from the current market price.

BUY EURCAD now for a four hour time frame bullish trend continuBUY EURCAD now for a four hour time frame bullish trend continuation ...............
STOP LOSS: 1.60037
This buy trade setup is based on hidden bullish divergence trend continuation trading pattern ...
Always remember, the trend is your friend, so whenever you can get a signal that the trend will continue, then good for you to be part of it
TAKE PROFIT : take profit will be when the trend comes to an end, feel from to send me a direct DM if you have any question about take profit or anything...
Remember to risk only what you are comfortable with... trading with the trend, patient and good risk management is the key to success here

How a Triple Breakout and Daily Reversal Signal Point to a 25%..How a Triple Breakout and Daily Reversal Signal Point to a 25% Bullish Opportunity on EURCAD
Introduction
A strong bullish signal has formed on the EURCAD currency pair, capturing the attention of traders using a combination of
breakout confirmation and daily chart reversal signals. With a clear confluence across the 4-hour, daily, and weekly timeframes,
this technical setup offers a well-supported case for a buy position with an estimated 25% upside, targeting the 1.6100 level.
Whether traded intraday or held for a few days, the structure of this trade offers exceptional technical clarity and reward
potential.
✅ Key Technical Highlights
🔹 4-Hour Breakout Confirmation
The EURCAD pair has broken decisively above a recent range high on the 4-hour chart. This breakout occurred on increased volume,
which validates the move as more than a false spike. Price action shows bullish momentum building as candles close strongly above
the 50-period EMA, indicating short-term strength.
🔹 Weekly Chart Breakout Structure
Zooming out, the weekly chart reveals that EURCAD has cleanly broken through a key resistance zone, which had previously
capped price several times. The breakout aligns with the long-term trend shift, reinforcing the bullish narrative from a macro
perspective. Support now sits firmly below at previous resistance.
🔹 Daily Chart Reversal Signal
The daily chart offers the most critical insight: a strong reversal pattern, potentially a bullish engulfing or morning star, has
formed near the breakout area. This suggests a change in sentiment and invites buying pressure as traders react to the clear
reversal signal after a recent pullback. This reversal provides
timing precision for the trade.
🎯 Take-Profit and Target Projection
The price target is placed at 1.6100, which corresponds to:
A previous structural high
A Fibonacci extension zone
A round psychological number respected historically
The move to this level offers a potential 25% profit window, depending on entry price and lot size. This makes it attractive for both day traders and short-term swing traders.
🕒 Trade Duration Outlook
While this breakout setup is forming across the weekly and daily charts, the 4-hour entry makes it highly suitable for day trading.
Traders who prefer intraday execution can look for a pullback to breakout support for entry, followed by momentum confirmation
from RSI or volume spikes.
Swing traders may hold the position over several days, aiming for the full stretch to the 1.6100 target, while trailing stops to lock in profits.
⚠️ Risk and News Awareness
Traders must remain cautious of:
Oil price movements, which directly impact CAD strength
Economic data from the Eurozone or Canada (GDP, employment, interest rate updates)
Central bank speeches that may introduce volatility
Risk should be limited by placing stop-loss orders just below the 4-hour breakout level or the low of the daily reversal candle.
📌 Why This EURCAD Setup Matters
This setup is more than just a breakout—it combines:
Multi-timeframe confirmation
Momentum breakout on the 4-hour chart
Weekly structure validation
Daily chart reversal timing
These factors build a strong technical case for bullish continuation and provide high confidence for experienced and new traders alike.
Conclusion
EURCAD presents a powerful trading opportunity backed by clear technical signals across major timeframes. With a 25% upside and
precise entry timing from a daily reversal pattern, this is the kind of setup traders seek for both fast profits and well-structured
trades. Whether approached as a day trade or a swing play, the EURCAD breakout is one to watch.
Disclaimer: This content is for educational and informational purposes only. It does not constitute financial advice or a
recommendation to buy or sell any financial instrument. Use a simulation trading account before you trade with real money and learn risk management and profit taking strategies.

EUR CadHead and shoulders pattern? using yellow horizontal line as resistance hope it passes my ema and continue selling to my support line .

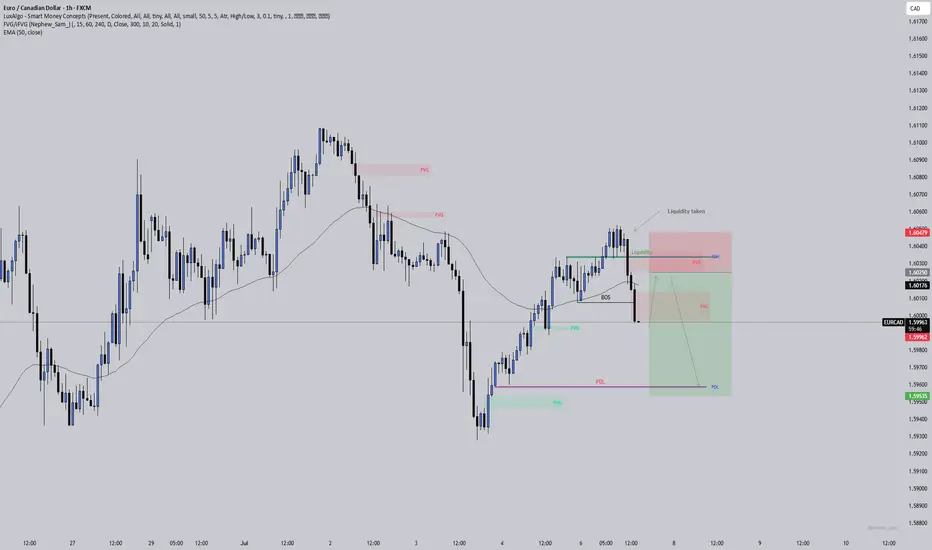
EURCAD: Liquidity taken, imbalance left behindPrice swept the liquidity above the previous day’s high and then broke structure to the downside. That’s often a sign that smart money was hunting stops before shifting direction. Now I’m watching for price to come back and fill the imbalance (FVG) it left after the break.
If that happens and price respects the FVG zone, we could see a continuation lower with the next target being the previous day’s low where more liquidity is likely sitting.
I’ve also added the 50 EMA here as confluence. It helps keep me trading in line with the broader market flow and stops me from fighting the trend.
This is one of those spots where patience is key . Let the market return to the zone on its own terms, wait for a reaction, and keep protecting your mindset just as carefully as your capital.
EURCAD has broken belowEURCAD has broken below the ascending channel, suggesting potential bearish continuation. The move targets 1.60048 and 1.59905, with a clear invalidation level set above 1.60530. We are monitoring for confirmation of bearish control unless bulls step in to push price back above the invalidation level.

EURCAD Swing SellEURCAD will decline from this area observing this head and shoulders pattern. Price seems to be exhausted and may reverse anytime now
