EURCAD Will Go Down! Sell!
Here is our detailed technical review for EURCAD.
Time Frame: 4h
Current Trend: Bearish
Sentiment: Overbought (based on 7-period RSI)
Forecast: Bearish
The market is approaching a key horizontal level 1.499.
Considering the today's price action, probabilities will be high to see a movement to 1.493.
P.S
Overbought describes a period of time where there has been a significant and consistent upward move in price over a period of time without much pullback.
Like and subscribe and comment my ideas if you enjoy them!
EURCAD trade ideas

EUR/CAD BEST PLACE TO SELL FROM|SHORT
Hello, Friends!
The BB upper band is nearby so EUR-CAD is in the overbought territory. Thus, despite the uptrend on the 1W timeframe I think that we will see a bearish reaction from the resistance line above and a move down towards the target at around 1.494.
✅LIKE AND COMMENT MY IDEAS✅

EURCAD bearish ideaHello, a bearish idea. I think EURCAD is in downword channel and is bouncing off a support.

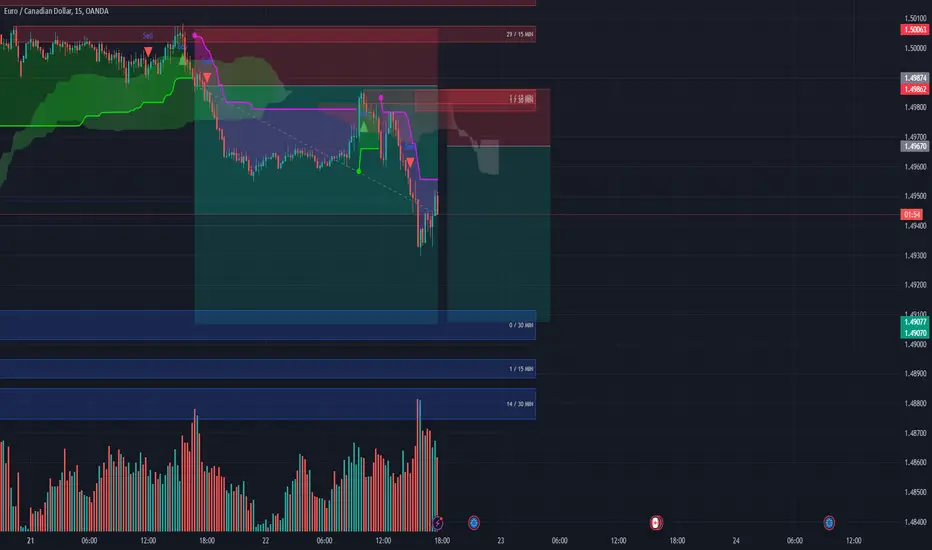
EURCAD Trading Opportunity! SELL!
My dear friends,
EURCAD looks like it will make a good move, and here are the details:
The market is trading on 1.5018 pivot level.
Bias - Bearish
Technical Indicators: Supper Trend generates a clear short signal while Pivot Point HL is currently determining the overall Bearish trend of the market.
Goal - 1.4970
Recommended Stop Loss - 1.5052
About Used Indicators:
Pivot points are a great way to identify areas of support and resistance, but they work best when combined with other kinds of technical analysis
———————————
WISH YOU ALL LUCK

Sell EUR/CAD Bearish ChannelThe EUR/CAD pair on the M30 timeframe presents a potential selling opportunity due to a recent downward breakout from a well-defined Bearish Channel pattern. This suggests a shift in momentum towards the downside in the coming Hours.
Key Points:
Sell Entry: Consider entering a short position around the current price of 1.4908, positioned close to the breakout level. This offers an entry point near the perceived shift in momentum.
Target Levels:
1st Support – 1.4866
2nd Support – 1.4834
Stop-Loss: To manage risk, place a stop-loss order above 1.4940. This helps limit potential losses if the price unexpectedly reverses and breaks back upwards.
Your likes and comments are incredibly motivating and will encourage me to share more analysis with you.
Best Regards, KABHI FOREX TRADING
Thank you.

EUR/CAD IN 4 HOUR TIME FRAMEas we already see in previous analysis EUR/CAD in 1 day time frame show that market need to make a pullback to the upside,here in 4 hour time frame there is a demand zone that has already created,we can use that demand to find buy entry and targeting swing high.see you next time

EURCADEUR/CAD in 1 day time we see market is heading to the downside direction by creating highs and lows also there is break of market structures which happens when market is moving to the downside.

Quick Inertia Tactical LongFundamentals & Sentiment
EUR:
- Some recent positive economic data
CAD:
- 0.5 Cut should spur some short-term bearishness
Technical & Other
Setup: S(B)
Setup timeframe: 1h
Trigger: 1m (right after the BoC 0.5 cut announcement)
Medium-term: Range
Long-term: Range
Min target: Local high
Stop loss: 0.25%
Position size: 0.5 of the normal Risk Unit.

EUR_CAD WILL GO UP|LONG|
✅EUR_CAD went down to retest a horizontal support of 1.4880
Which makes me locally bullish biased
And I think that a move up
From the level is to be expected
Towards the target above at 1.4952
LONG🚀
✅Like and subscribe to never miss a new idea!✅

EURCAD: Long Trade with Entry/SL/TP
EURCAD
- Classic bullish pattern
- Our team expects retracement
SUGGESTED TRADE:
Swing Trade
Buy EURCAD
Entry - 1.4929
Stop - 1.4900
Take - 1.4977
Our Risk - 1%
Start protection of your profits from lower levels
❤️ Please, support our work with like & comment! ❤️

EURCAD H4 pullbackIm expecting price to take out the volume at 1.168 extension level and bounce from there completing a 3 wave correction.

EUR-CAD Local Long! Buy!
Hello,Traders!
EUR-CAD is going down
But the pair will soon
Hit a horizontal support
Of 1.4881 from where
A local bullish rebound
Will be expected
Buy!
Like, comment and subscribe to help us grow!
Check out other forecasts below too!

EURCAD💡Hello everyone, EURCAD chart analysis The price is moving within a slanted price channel. If the price rebounds from the current support area, we may witness a rise to the fulcrum area shown above.⬆️ If the price breaks the support level, the decline can continue to lower levels. ⬇️
⛔️It is not investment advice, for educational purposes only.

EURCAD Bearish Continuation LikelyThe overall structure is bearish. The presence of several bearish patterns (ascending wedge, bearish flags), multiple breaks of structure (BOS), and the price staying below the Ichimoku cloud strongly suggests that the downtrend is still in play.
The volume analysis further supports this, with higher volume on sell-offs and lower volume during upward retracements.
Unless the price breaks above the resistance zone (around 1.5010-1.5040) with strong volume, it is highly likely that the EURCAD pair will continue lower. A potential downside target is the support zone around 1.4920, and a break below this could open the way for further bearish continuation.
I'll place a sell order at 1.49671, in case Lagarde's later speech may make sudden moves / price manipulation.
EURCAD 15M ChoCH, OB, IMBSee that the price fill the IMB and mitigated OB, Now wait the price makes pullback into the new OB for confirmation entry. Don't forget to put your SL and do at your own risk. Correct me if I'm wrong

EURCAD Master Analysis, Pre ECB Speak.ECB speakers are coming onto the wires later today.
We already know from previous rhetoric that the ECB expects things to follow suite but is not making huge jumps or announcements. They have mentioned they expect easing and things are going well, but are not announcing exactly what they are going to do.
This speech is likely to confirm that and I do not expect any serious changes. The current downtrend on EUROCAD is mostly due to a more dovish approach via the ECB, albeit tentative. We know the BOC has committed to a faster easing cycle, so the matching of this reflects in price action.
Shorts preferred continually, now and on a rise further. Any major sentiment shift, should it occur, will skew this and result in a change of size / entry areas.
Awaiting speech and further price movements.

Bullish bounce off pullback support?EUR/CAD is falling towards the support level which is a pullback support and could bounce from this level to our take profit.
Entry: 1.49237
Why we like it:
There is a pullback support level.
Stop loss: 1.4879
Why we like it:
There is a pullback support level that us slightly below the 61.8% Fibonacci projection.
Take profit: 1.5007
Why we like it:
There is an overlap resistance level that is slightly below the 61.8% Fibonacci retracement.
Enjoying your TradingView experience? Review us!
Please be advised that the information presented on TradingView is provided to Vantage (‘Vantage Global Limited’, ‘we’) by a third-party provider (‘Everest Fortune Group’). Please be reminded that you are solely responsible for the trading decisions on your account. There is a very high degree of risk involved in trading. Any information and/or content is intended entirely for research, educational and informational purposes only and does not constitute investment or consultation advice or investment strategy. The information is not tailored to the investment needs of any specific person and therefore does not involve a consideration of any of the investment objectives, financial situation or needs of any viewer that may receive it. Kindly also note that past performance is not a reliable indicator of future results. Actual results may differ materially from those anticipated in forward-looking or past performance statements. We assume no liability as to the accuracy or completeness of any of the information and/or content provided herein and the Company cannot be held responsible for any omission, mistake nor for any loss or damage including without limitation to any loss of profit which may arise from reliance on any information supplied by Everest Fortune Group.

Bullish bounce?EUR/CAD is falling towards the pivot which has been identified as a pullback support and could bounce to the 1st resistance level.
Pivot: 1.49267
1st Support: 1.48808
1st Resistance: 1.50093
Risk Warning:
Trading Forex and CFDs carries a high level of risk to your capital and you should only trade with money you can afford to lose. Trading Forex and CFDs may not be suitable for all investors, so please ensure that you fully understand the risks involved and seek independent advice if necessary.
Disclaimer:
The above opinions given constitute general market commentary, and do not constitute the opinion or advice of IC Markets or any form of personal or investment advice.
Any opinions, news, research, analyses, prices, other information, or links to third-party sites contained on this website are provided on an "as-is" basis, are intended only to be informative, is not an advice nor a recommendation, nor research, or a record of our trading prices, or an offer of, or solicitation for a transaction in any financial instrument and thus should not be treated as such. The information provided does not involve any specific investment objectives, financial situation and needs of any specific person who may receive it. Please be aware, that past performance is not a reliable indicator of future performance and/or results. Past Performance or Forward-looking scenarios based upon the reasonable beliefs of the third-party provider are not a guarantee of future performance. Actual results may differ materially from those anticipated in forward-looking or past performance statements. IC Markets makes no representation or warranty and assumes no liability as to the accuracy or completeness of the information provided, nor any loss arising from any investment based on a recommendation, forecast or any information supplied by any third-party.

"EURCAD Stalls: A Prime Setup for Short Sellers""EURCAD Approaching Critical Resistance: A Strategic Short Opportunity in a Consolidating Market
The EURCAD pair is currently inching toward a pivotal resistance zone, having already tested the psychological key level at 1.5000. The market, on the daily timeframe, appears to be in a clear consolidation phase, with price action confined within a well-defined range. This consolidative behavior often signals indecision among market participants, but for those attuned to the technical nuances, it also presents a potential opportunity for strategic positioning.
As the pair approaches the resistance zone once again, my analysis suggests that we may witness a temporary breakout, with price potentially piercing above the 1.5000 level. This move would likely serve as a liquidity grab, a common occurrence in markets where price action flirts with psychological levels. Such "fake outs" are often engineered to trigger stop-losses of early short-sellers and draw in breakout traders, before the market reverses direction.
Given the range-bound nature of EURCAD, I am anticipating this potential false breakout to be short-lived. The pair is likely to retreat after testing the resistance zone, reversing course and beginning its descent back toward support. This behavior would align with the broader consolidation pattern and would offer an ideal entry point for short positions.
My primary target for this downward movement is the 1.49450 level, a critical area of support within this consolidating market. Should the price action roll over from the resistance zone as expected, the market could begin to test the lower boundaries of its current range. This level at 1.49450 has proven to be a significant floor for EURCAD, and it aligns with historical price behavior within this range-bound structure.
In essence, the EURCAD market is offering a textbook example of a consolidating environment, where price oscillates between defined support and resistance levels. For traders willing to wait for the right confirmation, the setup is primed for a potential short trade, particularly if the pair takes liquidity above the psychological 1.5000 level and begins to retreat. With my sights set on 1.49450 as a key target, I am poised to capitalize on what appears to be an ideal range-bound trade opportunity."

EURCAD 100 pips movementIf you're anticipating a 100-pip bullish movement in the EUR/CAD currency pair over the next 1-5 days, here's how you might interpret and analyze that scenario:
1. Current Price Movement
You expect EUR/CAD to rise by 100 pips, which indicates a potential strengthening of the Euro against the Canadian Dollar.
For instance, if the current price is 1.5000, a 100-pip upward movement would bring the price to 1.5100.
2. Timeframe: 1-5 Days
A 1-5 day timeframe is relatively short-term, which means you're expecting this movement within a trading week. Here's how to approach this in terms of trading or analysis:

EURCAD Short This is with the H4 trend
There is no pattern but EUR seems like it needs to weaken
There is a lot of consolidation with good divergence
stop loss of 40 pips

21.10.24 Morning ForecastPairs on Watch -
FX:EURUSD
FX:USDCHF
FX:GBPAUD
FX:EURCAD
A short overview of the instruments I am looking at for today, multi-timeframe analysis down to what I will be looking at for an entry. Enjoy!

Heading into 61.8% Fibonacci resistance?EUR/CAD is rising towards the resistance level which is a pullback resistance that is slightly above the 61.8% Fibonacci retracement and could reverse from this level to our take profit.
Entry: 1.50030
Why we like it:
There is a pullback resistance that is slightly above the 61.8% Fibonacci retracement.
Stop loss: 1.50776
Why we like it:
There is a pullback resistance level.
Take profit: 1.49549
Why we like it:
There is a pullback support level.
Enjoying your TradingView experience? Review us!
Please be advised that the information presented on TradingView is provided to Vantage (‘Vantage Global Limited’, ‘we’) by a third-party provider (‘Everest Fortune Group’). Please be reminded that you are solely responsible for the trading decisions on your account. There is a very high degree of risk involved in trading. Any information and/or content is intended entirely for research, educational and informational purposes only and does not constitute investment or consultation advice or investment strategy. The information is not tailored to the investment needs of any specific person and therefore does not involve a consideration of any of the investment objectives, financial situation or needs of any viewer that may receive it. Kindly also note that past performance is not a reliable indicator of future results. Actual results may differ materially from those anticipated in forward-looking or past performance statements. We assume no liability as to the accuracy or completeness of any of the information and/or content provided herein and the Company cannot be held responsible for any omission, mistake nor for any loss or damage including without limitation to any loss of profit which may arise from reliance on any information supplied by Everest Fortune Group.
