EurCad 06/19/25 NYPre-Analysis
1) Session Break (NY took out L)
2) Expecting? (Channel)
3) High Volume located at (Breach)
4) Leg being traded? (2)
5) Market digestion? (1hr)
6) Edge? (S1) higher TF is (4hr)
7) Edge Specifics? (S1H)
8) Continuation
9) Micro Timeframe (15min)
10) Class (A)
Improvements
hold trade as analyzed
scale in
EURCAD trade ideas

EUR/CAD BuyEntry – Buy-limit 1.5560 (front-run zone); back-up bid 1.5520 if you ladder.
Stop-loss – Hard stop 1.5410 (below 1.5500 break-fail line).
Targets
TP1 1.5750 – lock ~1.5 R; trail stop to break-even.
TP2 1.5900 – cash majority.
Runner 1.6000 – only if momentum is strong.
Expiry: cancel if not filled after 5 trading days.

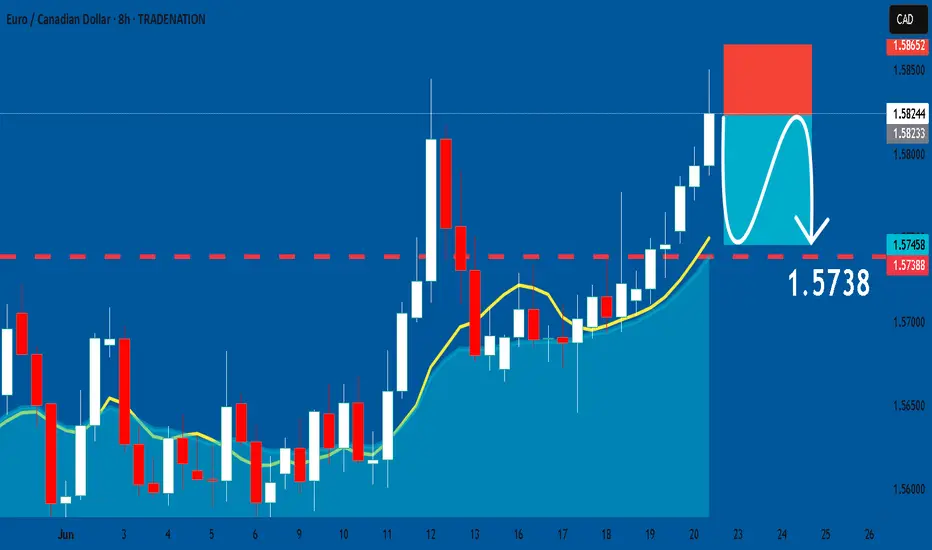
EURCAD: Short Trade Explained
EURCAD
- Classic bearish pattern
- Our team expects retracement
SUGGESTED TRADE:
Swing Trade
Sell EURCAD
Entry - 1.5823
Stop - 1.5865
Take - 1.5738
Our Risk - 1%
Start protection of your profits from lower levels
Disclosure: I am part of Trade Nation's Influencer program and receive a monthly fee for using their TradingView charts in my analysis.
❤️ Please, support our work with like & comment! ❤️
EUR/CAD SELLERS WILL DOMINATE THE MARKET|SHORT
Hello, Friends!
The BB upper band is nearby so EUR-CAD is in the overbought territory. Thus, despite the uptrend on the 1W timeframe I think that we will see a bearish reaction from the resistance line above and a move down towards the target at around 1.575.
Disclosure: I am part of Trade Nation's Influencer program and receive a monthly fee for using their TradingView charts in my analysis.
✅LIKE AND COMMENT MY IDEAS✅

EURCAD - Overextended and Ready to Reverse?The EURCAD pair is showing clear signs of exhaustion in its bullish trend on the monthly chart, with an overextended price that has already liquidated a significant high. Futures market analysis confirms the accumulation of short positions, suggesting a potential bearish movement driven by institutional players. On the daily chart, the price has shifted to a clear downtrend.
Technical Analysis:
🔹 Monthly Chart:
The price has reached overextended levels, signaling a possible reversal.
A key high has been liquidated, indicating potential demand exhaustion.
🔹 Futures Market Data:
Short positions are accumulating, showing that major market participants are positioning for a bearish move.
Commercial market conditions reflect a weakening bullish sentiment.
🔹 Daily Chart:
Structural change confirms a bearish trend.
Possible selling opportunities on pullbacks to recent resistance levels.

EURCAD Sell- Go for short term sell then manage your trade
- keep looking for sell even if price goes one more up
- potentially go lower
- in any case it has to at least go down to 1.5500 level or lower
- Refine entry with smaller SL for better RR, if your strategy allow
A Message To Traders:
I’ll be sharing high-quality trade setups for a period time. No bullshit, no fluff, no complicated nonsense — just real, actionable forecast the algorithm is executing. If you’re struggling with trading and desperate for better results, follow my posts closely.
Check out my previously posted setups and forecasts — you’ll be amazed by the high accuracy of the results.
"I Found the Code. I Trust the Algo. Believe Me, That’s It."


EURCAD BUY SETUPWe have transitioned from a downtrend to and up trend as shown by the transition for lower low and lower high to a higher high and potential higher low. we have pulled back to a key level for an entry.

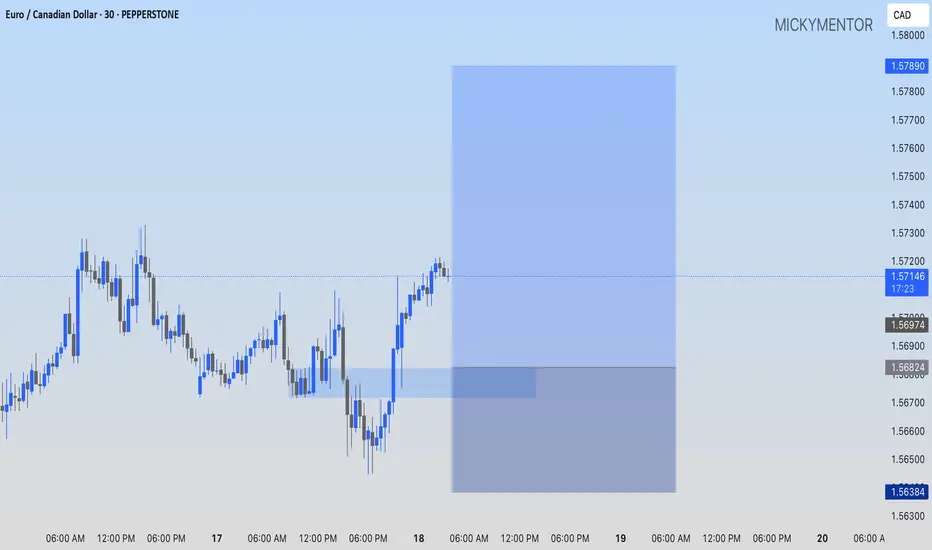
EURCAD: I'M GOING LONG!!!PEPPERSTONE:EURCAD I'm buying from 1.56824 while maintaining 1.57890 as my profit target.
EURCAD Set To Fall! SELL!
My dear subscribers,
This is my opinion on the EURCAD next move:
The instrument tests an important psychological level 1.5718
Bias - Bearish
Technical Indicators: Supper Trend gives a precise Bearish signal, while Pivot Point HL predicts price changes and potential reversals in the market.
Target - 1.5674
My Stop Loss - 1.5743
About Used Indicators:
On the subsequent day, trading above the pivot point is thought to indicate ongoing bullish sentiment, while trading below the pivot point indicates bearish sentiment.
Disclosure: I am part of Trade Nation's Influencer program and receive a monthly fee for using their TradingView charts in my analysis.
———————————
WISH YOU ALL LUCK

EURCAD: AN OPPORTUNITY TO GO LONG.PEPPERSTONE:EURCAD Going long at current market price, my target is 1.57893

EURCAD bullish ideaWe are expecting a continuous bullish move on EURCAD after a clear breakout and Choch on the H4. We patiently wait for a bullish candle confirmation at the demand before continuation.


Eurcad LongTradeable idea, this pair broke through the trend line and it seems like it might touch it from above. Look carefully at happens here and look to go long where possible.

EUR/CAD Long Bias🚀 EUR/CAD – Strong Long Opportunity Based on Multi-Factor Confluence
Over the past week, I conducted a comprehensive macro and sentiment-driven analysis across G10 FX pairs. Among several potential setups, EUR/CAD emerged as the most fundamentally and technically aligned long opportunity, supported by a confluence of high-probability signals across positioning, macro divergence, and capital flow sentiment.
🔍 Key Drivers Behind the EUR/CAD Long Bias:
1️⃣ Macroeconomic Divergence (ENDO View)
🇪🇺 Eurozone has shown relative stability in core macro indicators:
Inflation continues to cool, providing flexibility for ECB rate guidance.
GDP growth remains structurally flat but not contracting — suggesting resilience.
🇨🇦 Canada, on the other hand:
Shows a deteriorating inflation-growth mix.
Retail Sales and Industrial Production trends are softening.
ENDO analysis flags CAD as one of the weakest among G10 currencies.
2️⃣ Positioning – COT Report & Z-Scores
Speculative traders are increasing their long exposure to EUR (COT net longs rising +13,887 last week).
Z-Score on EUR long positions: +1.33 → statistically elevated interest in long EUR exposure.
CAD positioning is flat-to-negative, with no bullish buildup in speculative flows.
This gives EUR a clear relative edge in terms of speculative conviction.
3️⃣ Score & EXO Sentiment Framework
EUR/CAD is one of few pairs showing clear directional consensus across:
✅ EXO Score Sheet: Long Bias confirmed.
✅ RR_w Sheet: Strong risk/reward rating supports further upside.
✅ IR Forecast Sheet: ECB-CAD policy spread favors EUR strength in medium term.
4️⃣ Market Sentiment – Risk Regime
We are currently in a “Risk-On” sentiment regime, which generally favors currencies like EUR over defensive, commodity-linked currencies like CAD.
CAD tends to underperform in reflationary sentiment waves — especially when Oil fails to support the currency.
5️⃣ Cluster & Trend Confirmation
While not a primary factor, cluster analysis shows that EUR/CAD is not in a weak trend regime.
Trend alignment over 30 and 14 days remains favorable.
🔚 Conclusion:
EUR/CAD is one of the few pairs this week that aligns across all analytical fronts: macro, positioning, sentiment, and structure. In a crowded FX environment, such confluence is rare and valuable.

POSSIBLE BUY OPPORTUNITY ON EURCADAfter ranging for over a month, EURCAD has finally made a breakout to the upside. We see the formation of a demand zone of which we can expect a classical breakout and re-test!


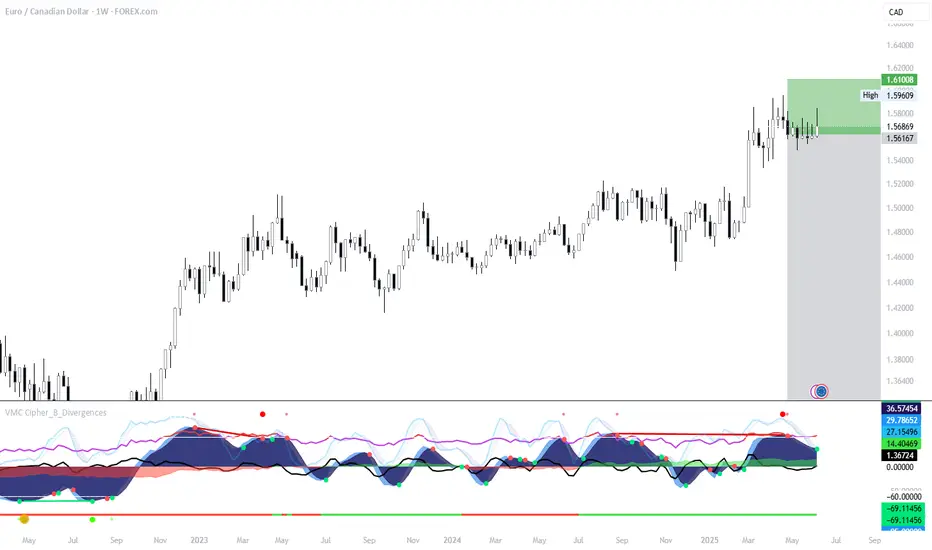
EUR/CAD Weekly Short Setup – Bearish Reversal Play
Initiated a short position on EUR/CAD from a key resistance zone after a significant upward move showing signs of exhaustion.
🔻 Entry: ~1.5689
🔻 Stop Loss: 1.6100 (Approx. 3.10%)
🎯 Take Profit: 1.3390 (Approx. 14.67%)
⚖️ Risk/Reward Ratio: 4.73
Price is reacting to a weekly supply zone with multiple confluences, including weakening bullish momentum on the VMC Cipher B indicator. The divergence signals a potential top, supporting a bearish outlook.
Looking for a move back to the lower range of the broader consolidation. Patience is key on this swing setup.
#EURCAD #ForexShort #SwingTrade #TechnicalAnalysis #RiskReward #TradingView
EC 6/12/25 APre-Analysis
1) Session Break (L took out A)
2) Expecting? (Trend)
3) High Volume located at (End)
4) Leg being traded? (3)
5) Market digestion? (15 min)
6) Edge? (S2) higher TF is (1hr)
7) Edge Specifics? (S2R)
8) Refresh
9) Micro Timeframe (15min)
10) Class (A)

EUR-CAD An Interesting Setup! Buy!
Hello,Traders!
EUR-CAD is trading in an
Uptrend along the rising
Support which now
Confluences with the falling
Support line as well so as the
Pair was making a bearish
Correction we will be expecting
A bullish rebound from the
Confluence area and a further
Bullish move up
Sell!
Comment and subscribe to help us grow!
Check out other forecasts below too!
Disclosure: I am part of Trade Nation's Influencer program and receive a monthly fee for using their TradingView charts in my analysis.

EUR/CAD Best Place To Sell Very Clear , Ready For 250 Pips ?Here is my opinion on EUR/CAD , I See that the price will touch 1.59500 and then go down very hard cuz it`s a very good res area and forced the prices to go down very hard last time and prove that it`s a good res , so i will sell this pair when the price touch this area and give us a good bearish price action for confirmation .

EUR/CAD SELLAs you see from the chart it is a huge sell chance for EUR/CAD welcome on board ladies and gentleman. This is your captain talking take care of each other because price will going to crash soon!

EUR_CAD LOCAL SHORT|
✅EUR_CAD is going up now
But a strong resistance level is ahead at 1.5760
Thus I am expecting a pullback
And a move down towards the target of 1.5660
SHORT🔥
✅Like and subscribe to never miss a new idea!✅
Disclosure: I am part of Trade Nation's Influencer program and receive a monthly fee for using their TradingView charts in my analysis.
