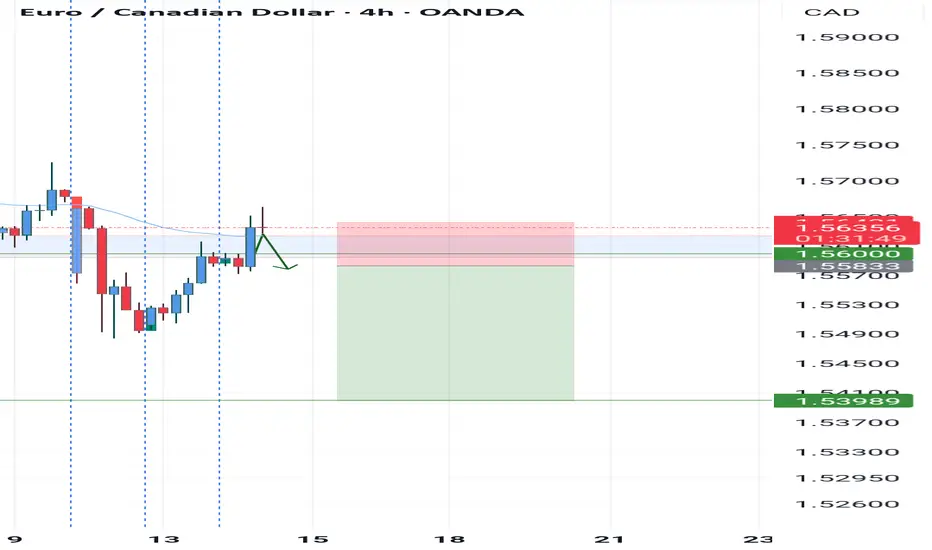
EURCAD Buy/Sell Setup- Go for short term buy if want
- after that don't miss the next down move
"I Found the Code. I Read the Algo. Believe Me, That’s It."
EURCAD trade ideas

EURCAD SellAnother good selling opportunity for EURCAD above 1.56.. Hold sell positions until 1.5220 and be rich !

EURCAD: Bearish Outlook For Next Week Explained🇪🇺🇨🇦
Earlier, I shared a very bearish outlook for EURCAD on a daily time frame.
During the NY session on Friday, the price retested a broken support
of the flag and formed a head and shoulders pattern on that.
Its neckline violation provides a strong bearish confirmation.
I expect a bearish continuation on Monday.
Goal - 1.5505
❤️Please, support my work with like, thank you!❤️
I am part of Trade Nation's Influencer program and receive a monthly fee for using their TradingView charts in my analysis.

EUR/CAD: Potential Short Opportunity !!Hey Traders,
Price is showing signs of weakness after tapping into key supply zones.
Lower highs forming, potential for further downside. Watching for clean breakdown and continuation to the downside.
Not financial advice. Always do your own research and manage your risk!
#EURCAD #Forex #TradingView #PriceAction #SupplyAndDemand #Bearish #Breakdown #ForexTrading #TechnicalAnalysis #SmartMoney #SwingTrading

EURCAD H2 SHORT PositionThe combination of evidence of a block order, a head and shoulders pattern, and a negative hidden divergence along with a shift in the market can be a good opportunity for short positions.

EURCAD: Another Bearish Pattern 🇪🇺🇨🇦
Earlier, we spotted a head & shoulder pattern on EURCAD on a daily
and a confirmed breakout of its neckline.
Analysing a price action, I spotted another bearish formation today.
The price formed a bearish flag pattern, and it is retesting a broken
trend line at the moment.
I think that the pair may drop lower soon.
Next support - 1.5503
❤️Please, support my work with like, thank you!❤️
I am part of Trade Nation's Influencer program and receive a monthly fee for using their TradingView charts in my analysis.

A LESSON IN PATIENCE!!!! Part 3 of EURCAD SELLS!!!All the information you need to find a high probability trade are in front of you on the charts so build your trading decisions on 'the facts' of the chart NOT what you think or what you want to happen or even what you heard will happen. If you have enough facts telling you to trade in a certain direction and therefore enough confluence to take a trade, then this is how you will gain consistency in you trading and build confidence. Check out my trade idea!!
www.tradingview.com

EurcadI posted this analysis few days ago and we were expecting price to push down and we have price now on our zone we will wait for a change of structure in the 4hr for the market to close the candle stick den we will enter the trade on de London section

EUR/CAD – Bullish Setup with Buy Limit StrategyPair: EUR/CAD
Trend: BULLISH
Entry (Buy Limit): 1.5651
Stop Loss (SL): 1.5634
Take Profit 1 (TP1): 1.5668 (1:1 R:R)
Take Profit 2 (TP2): 1.5685 (1:2 R:R)
Lot Size: 0.82
Total Risk: $200
Total Reward Potential: $300
✅ Trade Strategy: Buy the Dip
In this setup, I’m placing a Buy Limit order at 1.5651, aiming to enter the market on a pullback within the current bullish trend. This technique allows me to get in at a better price before the next upward move.
I’ve split the trade into two parts:
Trade 1:
Risk: $100
Reward: $100
Target: TP1 @ 1.5668 (1:1 Risk:Reward)
Trade 2:
Risk: $100
Reward: $200
Target: TP2 @ 1.5685 (1:2 Risk:Reward)
This strategy locks in early profit while allowing for additional upside capture if the trend continues.
🔍 Market Analysis: Why Bullish on EUR/CAD?
1. Strong Euro Fundamentals
The Euro remains supported by positive sentiment surrounding ECB policy, as inflation control remains a priority. Investors are favoring EUR over other majors.
2. Weakness in Canadian Dollar
CAD is under pressure due to soft oil prices and dovish signals from the Bank of Canada. Lower energy demand is a drag on CAD performance.
3. Technical Outlook
Current price action shows a classic pullback opportunity
Market structure: Higher highs, higher lows remain intact
Price nearing a strong support zone at 1.5650
RSI resetting below 50, ready to bounce
50 EMA still above 200 EMA – bullish confirmation
📌 Summary:
I'm taking advantage of the bullish structure with a Buy Limit at support, aiming to catch the next leg higher. With clearly defined SL and TP levels, and a balanced risk approach, this trade setup follows the "buy low in trend" principle.
🛑 Always manage your risk and watch for high-impact news events that may influence EUR or CAD.
🔗 Hashtags:
#EURCAD #BuyLimit #ForexTrading #TradingSetup #BullishTrend #PriceAction #TechnicalAnalysis #SmartMoney #RiskManagement #ForexSignals #CurrencyTrading #ForexCommunity #SwingTrading #ForexLife #TradeSmart

ANANLYSE EUR CADeur cad now to way for get 144 point for finish first wave in frime 1h
for more free analyse like and folow our profile forex crypto stocks future anything
note :for help or ask for the best place fore entre just inbox me

EURCAD SELL/SHORTBy utilizing levels, historical patterns, , we can formulate a hypothesis that the market might follow a similar trajectory if bearish sentiment prevails.

EUR/CAD Trade Setup – Bullish BiasMarket Overview – Why EUR/CAD is Bullish
1. Euro Supported by Fundamentals
The Eurozone is showing signs of recovery, with better-than-expected economic data and a stable inflation outlook. This strengthens investor confidence in the EUR.
2. CAD Weakness Driven by Oil & BoC Policy
Oil prices remain soft due to slowing global demand, which directly impacts the Canadian Dollar. Additionally, the Bank of Canada has taken a more dovish tone, which adds further downward pressure on CAD.
3. Technical Signals Align with Bullish Outlook
Strong rebound from 1.5540 support zone
Price structure shows higher lows and higher highs
50 EMA crossing above 200 EMA (bullish signal)
RSI holding above 50, indicating bullish momentum without being overbought
4. Sentiment Favoring EUR Over CAD
Current market sentiment leans towards strength in the Euro over commodity-linked currencies, especially amid uncertainty and risk-off flows.
Summary:
This setup blends technical confirmation, fundamental strength, and a smart two-part risk-managed strategy. The first position is designed to bank quick gains, while the second gives us a chance to ride the bullish trend further — all while keeping total risk limited to $200.
Risk Management: As always, stick to your SL and be ready to adjust if major economic events hit the calendar.
EUR/CAD Trade Setup – Bullish Bias
Pair: EUR/CAD
Trend: BULLISH
Entry (Buy Stop): 1.56012
Stop Loss (SL): 1.55300
Take Profit 1 (TP1): 1.56728
Take Profit 2 (TP2): 1.57086
Lot Size: 0.39
Total Risk: $200
Total Reward: $300
Strategy Breakdown: Two Trades, Managed Risk
We're executing this setup with two positions, each with different risk-reward targets:
Trade 1:
Risk: $100
Reward: $100
Target: TP1 @ 1.56728 (1:1 R:R)
Objective: Secure quick profits
Trade 2:
Risk: $100
Reward: $200
Target: TP2 @ 1.57086 (1:2 R:R)
Objective: Capture extended move if momentum continues
This dual-trade strategy allows us to lock in profits early while still having exposure to larger upside potential with controlled risk.
#EURCAD #ForexTrading #TradingStrategy #TechnicalAnalysis #FundamentalAnalysis #ForexSetup #TradeIdea #BullishSetup #PriceAction #RiskManagement #ForexSignals #MarketAnalysis #CurrencyTrading #ForexCommunity #TradingPlan #ForexLife #ForexTrader #DayTrading #SwingTrading #SmartMoney

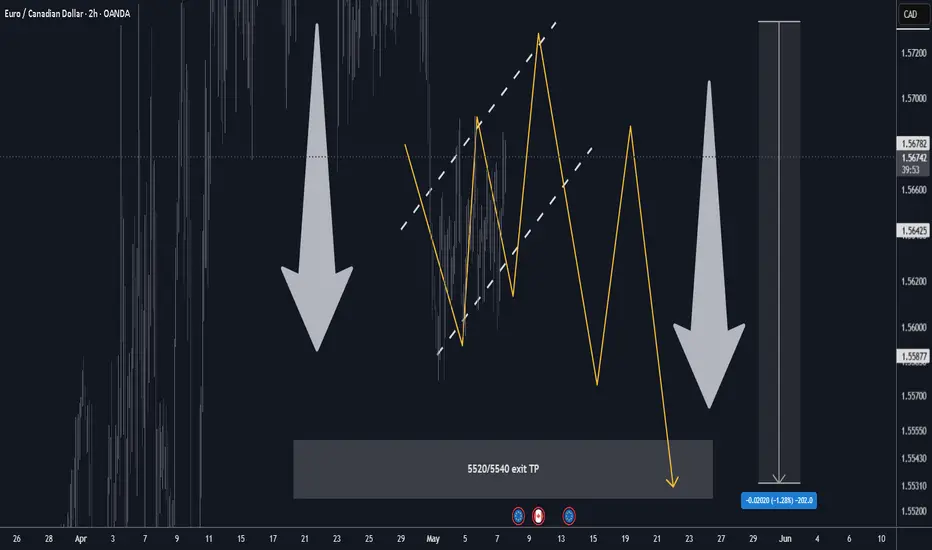
EURCAD H2 Best Level to SHORT/HOLD +100/+200 pips🏆 EURCAD Market Update H2 chart
📊 Technical Outlook
🔸broke down on high vol
🔸compression BEAR FLAG
🔸Mid-term: BEARS 5500
🔸Status: compression/dump
🔸5710/5720 heavy S/R BEARS
🔸5520/5540 key s/r zones below
🔸Price Target Bears: 5520
🔸final pump possible
🔸strategy: SHORT SELL 5710/5720
🔸SL 40 pips TP1 +100 pips TP2 +200 pips
🔸swing trade setup for patient traders
📊 Forex Market Update (May 7, 2025)
🇪🇺 EUR/USD
📉 Price: \~1.1370
USD strength ahead of Fed dampens Euro
German HCOB Services PMI fell in April; ECB rate-cut bets rising
Key Levels: Support 1.1320 | Resistance 1.1380
🇬🇧 GBP/USD
📉 Price: \~1.3320 (slid from recent highs)
Modest USD buying ahead of Fed decision
BoE policy caution keeps Pound in check
Key Levels: Support 1.3300 | Resistance 1.3400
🇺🇸 DXY (US Dollar Index)
📈 Price: \~99.39
Supported by rising U.S. yields and Fed rate-cut delays
Pressured by strategic uncertainty and trade tensions
Key Levels: Support 98.00 | Resistance 100.00
EUR/CAD For Bullishyou can go long now
or
wait for entry point and then go long
general trend is up trend
have fun :)

Ready to raid the EUR/CAD ("Euro vs Loonie") with precision?✨ Greetings, Market Mavericks & Currency Pirates! ✨
🔍 Thief Trading’s Heist Blueprint (Bearish Raid Mode)
Short entry activated—targeting the high-risk Green MA Zone.
Oversold market? Consolidation? Reversal trap? Bullish robbers lurking?
Perfect. We strike where they least expect. 🎯 Steal the profits and vanish before the alarms sound!
⚡ Entry Strategy (Sneaky & Strategic)
"The vault’s unlocked—swipe the bearish loot at any price!"
*→ Prefer sell limits within 15-30 min (nearest swing highs/lows for clean pullbacks).*
🛡️ Stop Loss (Escape Route)
*→ Thief SL set at nearest swing high/low (4H timeframe).*
→ Adjust based on risk, lot size, & multiple orders.
💰 Take Profit (Loot & Scoot)
→ Primary Target: 1.53000
→ Or escape early if the heist gets too hot.
🌪️ Market Context (Why This Raid?)
Bearish momentum fueled by:
Macroeconomic tides
COT whispers
Sentiment shadows
Check out there👉🏻🌏🌎🔗🔗
📊 Sentiment Snapshot (May 13, 2025, UTC+1)
Retail Thieves:
🟢 Bullish: 34% 😏 (Betting on Eurozone rebound)
🔴 Bearish: 56% 😣 (CAD strength, ECB dovishness)
⚪ Neutral: 10% 🤔
Institutional Thieves:
🟢 Bullish: 29% 💼 (EUR hedges on global risks)
🔴 Bearish: 61% ⚠️ (CAD oil rally, EUR slump)
⚪ Neutral: 10% 🧐
🚨 Trading Alert (News Survival Kit)
News = Chaos. Protect your loot:
Avoid new trades during releases.
Trailing stops = Profit shields.
💎 Boost This Heist → Fuel Our Next Raid!
Hit 💥Boost💥 to join the crew. More market heists = More stolen pips. 🏴☠️
Stay sharp—another heist drops soon. Until then, trade sly & profit big!
— Thief Trading Syndicate 🎩🔓

SELL EURCAD for bullish trend reversal STOP LOSS: 1.5678SELL EURCAD for bullish trend reversal
STOP LOSS: 1.5678
Regular Bearish Divergence
In case of Regular Bearish Divergence:
* The Indicator shows Lower Highs
* Actual Market Price shows Higher Highs
We can see a strong divergence on the MACD already and There is a strong trend reversal on the daily time frame chart.....
The daily time frame is showing strength of trend reversal from this level resistance so we
are looking for the trend reversal and correction push from here .....
TAKE PROFIT : take profit will be when the trend comes to an end, feel from to send me a direct DM if you have any question about take profit or anything
Remember to risk only what you are comfortable with….....trading with the trend, patient and good risk management is the key to success here

NO SET UP = NO TRADE....so be PATIENT!!! EURCAD SELL part 2All the information you need to find a high probability trade are in front of you on the charts so build your trading decisions on 'the facts' of the chart NOT what you think or what you want to happen or even what you heard will happen. If you have enough facts telling you to trade in a certain direction and therefore enough confluence to take a trade, then this is how you will gain consistency in you trading and build confidence. Check out my trade idea!!
www.tradingview.com


EURCAD 14/05/2025Weekly:
-Bullish M pattern.
-Liquidity sweep.
Daily:
-Inverse H&S pattern.
4H:
-Bullish M pattern.
-Inverse H&S pattern.

EUR/CAD is Poised for a DeclineThe pair is trading within a channel and remains below the Ichimoku cloud. Recently, it failed to break above this channel, and with the formation of a bearish candle, EUR/CAD looks ready to drop toward 1.545.

EUR/CAD For Bullishyou can go long now
or
wait for pull-back near by entry point and then go long
general trend is up trend
have fun :)

EURCAD Bearish Breakdown – More Downside Potential Ahead?# EURCAD Bearish Breakdown – More Downside Potential Ahead?
**Analysis:**
EURCAD has broken below a key support level at **1.5710**, which previously acted as a consolidation base. This breakdown could signal the start of a deeper bearish move.
The market structure is clearly shifting to the downside, with **lower highs and lower lows** forming. If bearish momentum continues, the price could drop toward the psychological zones around **1.5000** and potentially **1.4500**.
---
**Key Technical Highlights:**
- **Breakdown level:** 1.5710 (former support)
- **Structure:** Bearish
- **Target zone:** 1.5000 – 1.4500
- **Invalidation:** Bullish recovery above 1.5710
---
**Trade Idea (Not Financial Advice):**
Watch for retests below 1.5710 to confirm bearish continuation. Short positions may be considered with proper risk management.
---
> **Disclaimer:**
> This analysis is for educational and informational purposes only and does not constitute financial advice. Always do your own research before making trading decisions. Trading involves risk, and past performance is not indicative of future results.

EurcadAs we can see we hv t ime frame on a down trend am waiting for 4h to change direction ans then retest on de resistance zone den we sell