
Euro / Canadian Dollar forum


🎯 TRADE SETUP (Scalping/Day Heist)
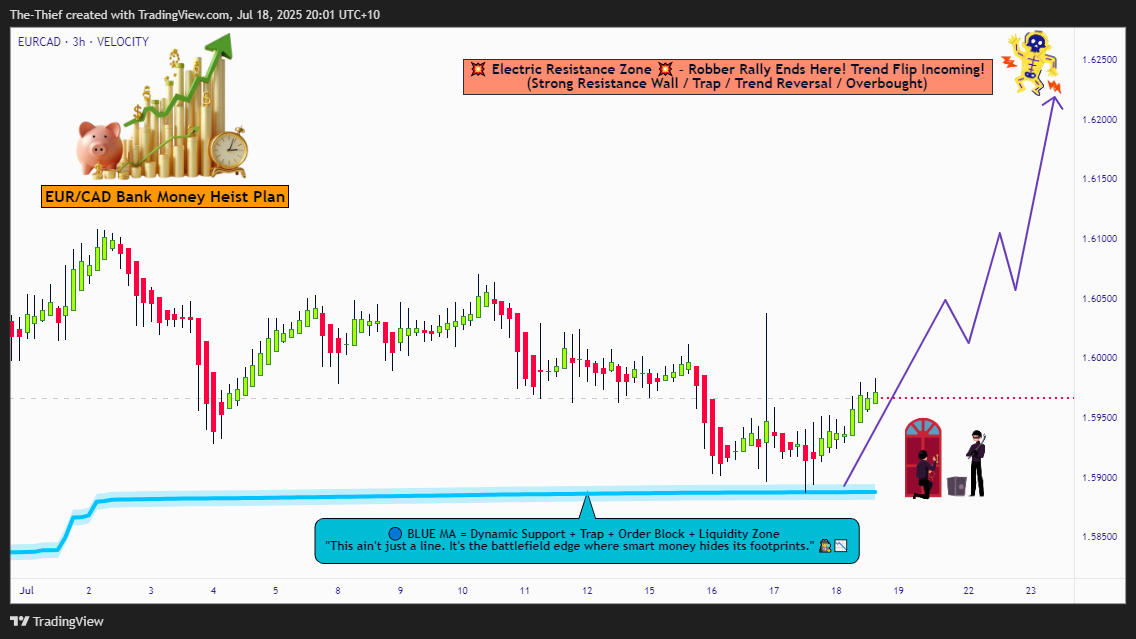
📈 Entry (Bullish Raid):
"The vault door is cracked—enter anywhere!"
Pro Thief Move: Use buy limit orders near swing lows (15M/30M) for sneaky pullback entries.
Advanced Raid Tactics: Layer entries (DCA-style) for maximum loot efficiency.
🛑 Stop Loss (Escape Route):
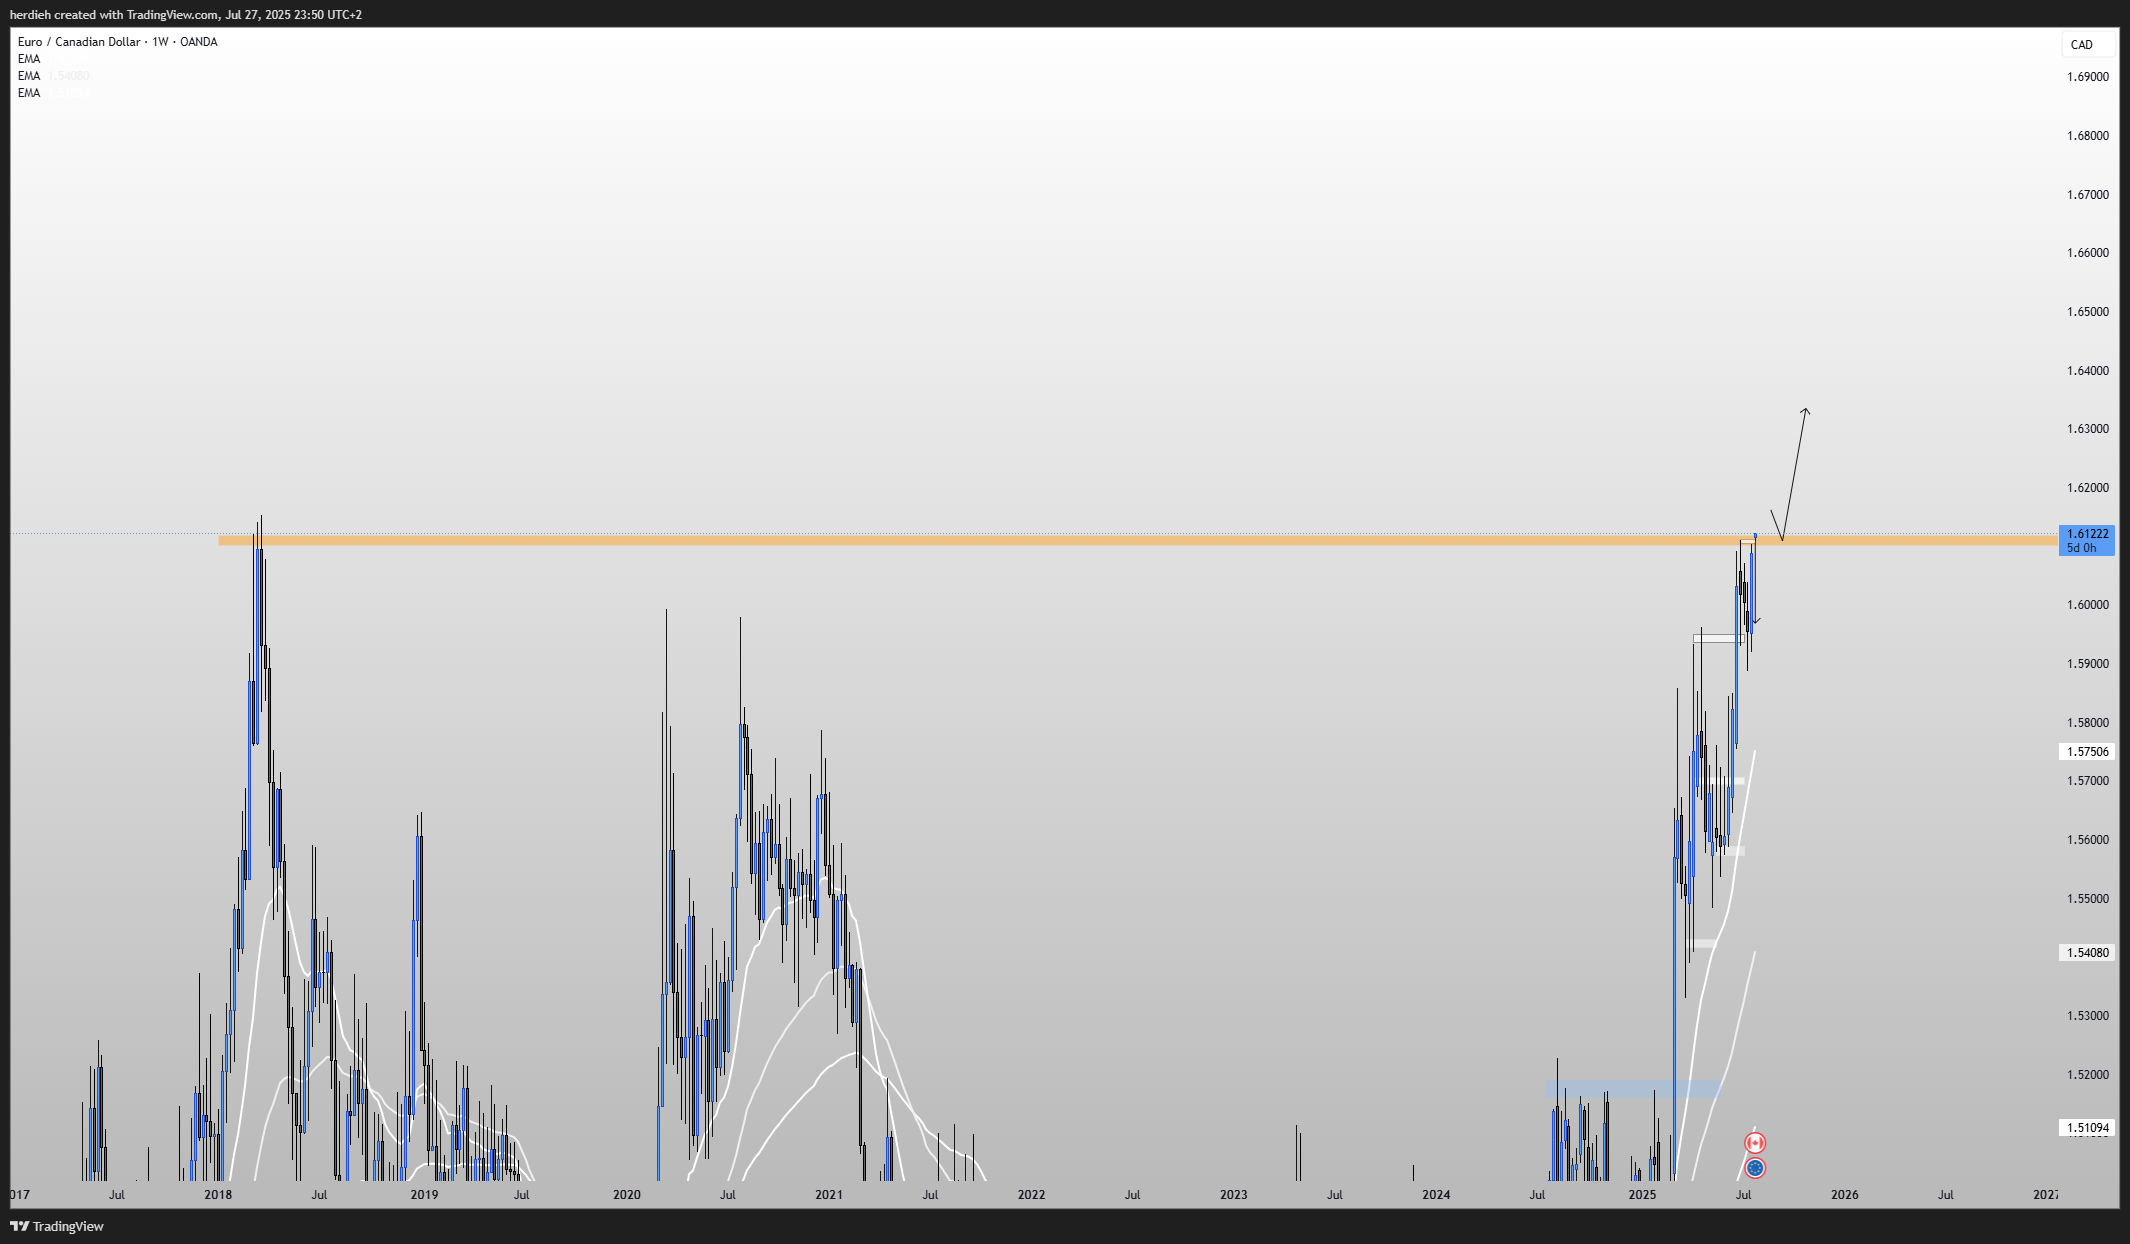
Swing Low (4H) = 1.58800 (Adjust based on your risk tolerance & lot size!)
Thieves’ Golden Rule: "No heist is worth a jail sentence!" 🚔💨
🎯 Take Profit (Escape Before the Cops Arrive!):
Primary Target: 1.91000 (or exit early if resistance gets too hot!)
⚠️ Danger Zone: High-voltage resistance = Bear Trap Territory! ⚡🐻
Target1 1.6105
if Target 1 is breached
Target 2 1.6140
Support 1.6030
At the EXACT SAME SPOT AS SUNDAY NIGHT