EUR/CNY Short Targets - Bearish HarmonicEUR/CNY Short Targets - Bearish Harmonic
The EUR/CNY pair is currently exhibiting a bearish harmonic pattern, indicating a potential downward movement.
As per algo analysis, downside targets are shown on Chart.
Enjoy!
EURCNY trade ideas

long toward 7.2as we seen a divergence on weekly time frame and also a previous completed wolfe wave we believe that euro will increases against CNY
tp/s are specified based which is first one is on the ema200
any comments please share
tnx


Upside perspectives for the Yuan over the medium-termThe Yuan, which is slowly converging toward its purchasing power parity and remain undervalued, is set to appreciate if we refer to its long-term trend versus the Euro.


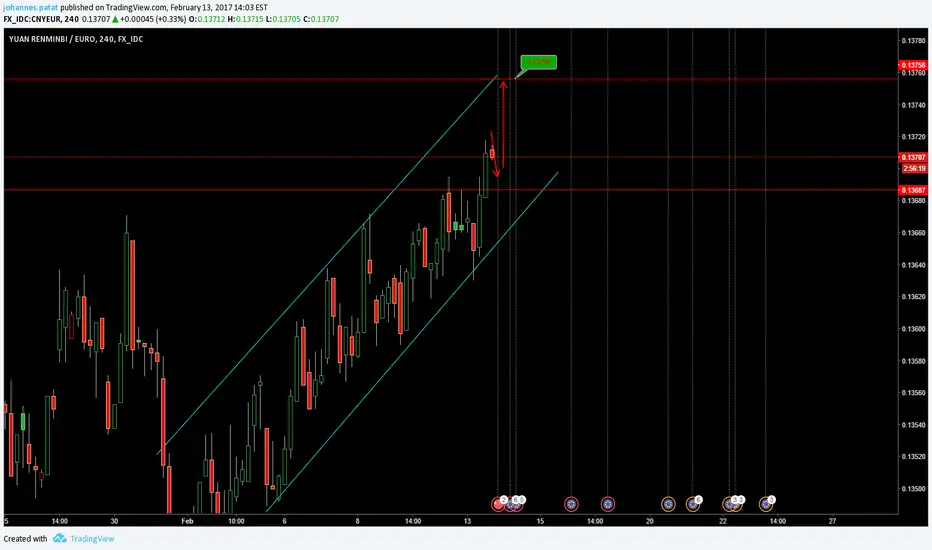
Shooting off with the CNYEURBullish impulse detected. Going up, boys and girls. I always say this, and I will say it again, nothing I say is financial advice. Think for yourselves! Fibonacci goals in green or purple, invalidation is in red. Fractals never lie and Fibonacci series shows us a few goals out of a million or more possibilities.

EURCNY bullish.Quite a similar picture to EURJPY. Pivot confirmed here and we are in impulse. Goals are in green, invalidation in red. This is not financial advice, please do you own research and for chrissake's think for yourselves.


📘 A small but very useful book! TRADE DIARY is most important!👨💻 Do you want to earn money on the exchange? I am sure that many people will answer this question in the affirmative-YES! Do you know what you need to do? Develop your own trading system and follow it clearly, recording all your trades and analyzing them after completion! If you don't, you probably don't earn any money. By the way, in a recent correspondence with Alexander Elderom, he confirmed it to me, said that of all that he did in trade — the most important thing is to KEEP a DIARY of TRANSACTIONS!
🙇 This book is very simple and written in a clear language. The author offers a working system, and if it does not suit you, gives you options for building your system. I believe that it can be read, and even reread again (who has already read it). After all, 10 years later, when I first met her, I have already become a different person and perceive her in a new way. And of all the TOP ideas in the book, I think the most important is the idea of building a table of the probability of the price move. You can see it below.
If you've read this book, which idea did you like the most? What interesting and useful things have you learned and used in your work?

CNYEUR, Triangle Descending (bullish)STATUS = Confirmed
CURRENT CONFIDENCE = 64%
TARGET (EXIT) PRICE = 0.125539 EUR
BREAKOUT (ENTRY) PRICE = 0.125210 EUR
DISTANCE TO TARGET PRICE = 0.27% (3.3 pips)
EMERGED ON Jul 15, 10:00 AM (UTC)
CONFIRMED ON Jul 15, 03:48 PM (UTC)
WITH CONFIDENCE LEVEL =75%
Tickeron AI shows that the Descending Triangle pattern is formed when the price of a pair establishes a support level (1, 3, 5) and bounces off that level to a declining resistance level, creating a down-sloping top line (2, 4). The breakout can either be up or down, depending if the resistance or highest support level is broken first.
This pattern is commonly associated with directionless markets, since the contraction (narrowing) of the market range signals that neither bulls nor bears are in control.
Trade idea
Once the price breaks out from the top pattern boundary, day traders and swing traders should trade with an UP trend. Consider buying a pair or a call option at the breakout price level. To identify an exit, compute the target price by adding the pattern height from breakout point. For upward breakouts the level is the highest high within the triangle (2). Pattern height is the difference between the level of the bottom horizontal line and the highest high.
To limit potential loss when price suddenly goes in the wrong direction, consider placing a stop order to sell at or below the breakout price.

CNYEUR, Triple Bottoms (bullish)STATUS = Confirmed
CURRENT CONFIDENCE = 63%
TARGET (EXIT) PRICE = 0.125338 EUR
BREAKOUT (ENTRY) PRICE = 0.125110 EUR
DISTANCE TO TARGET PRICE = 0.09% (1.1 pips)
EMERGED ON Jul 15, 10:00 AM (UTC)
CONFIRMED ON Jul 15, 02:17 PM (UTC)
WITH CONFIDENCE LEVEL = 72%
Tickeron AI shows that the Triple Bottom pattern appears when there are three distinct low points (1, 3, 5) that represent a consistent support level. The pair tests the support level over time but eventually breaks resistance and makes a strong move to the upside.
This type of formation happens when sellers can not break the support price, and market participants eventually pour in.
Trade idea
Once the price breaks out from the top pattern boundary, day traders and swing traders should trade with an UP trend. Consider buying a pair or a call option at the breakout price level. To identify an exit, compute the target price by adding the pattern’s height (highest price minus the bottom price support level) to the breakout level the highest high. When trading, wait for the confirmation move, which is when the price rises above the breakout level.
To limit potential loss when price suddenly goes in the wrong direction, consider placing a stop order to sell at or below the breakout price.


CNYEUR Chart, Rate and Analysis — TradingViewCalculation For Trading:
Resistance Level: 7.955
Resistance Level : 7.891
Resistance Level : 7.846
Support Level : 7.738
Support Level : 7.674
Support Level : 7.630
If you are looking for Forex pairs with good return, EURCNY can be a profitable investment option. EUR/CNY rate equal to 7.787 at 2020-03-03 (today's range: 7.747 - 7.802). Based on our forecasts, a long-term increase is expected, the Forex rate prognosis for 2025-03-01 is 7.799. With a 5-year investment, the revenue is expected to be around +0.15%. Your current $100 investment may be up to $100.15 in 2025.


Buying Chinese Yuan or shorting the EURCNYThe ERUCNY pair seems to be making a retracement after the run-up that started in June and lasted until September 2018.
I will be trading this unleveraged. I am just buying and holding Chinese Yuan without using a broker that lends me money to leverage my bet.
Target 1 is at the 50% retracement of the June-September move.
Target 2 at the 68% and target 3 at the74% retracement level which also aligns with a support and resistance level.
I will sell the Yuan if or as it hits these targets or if the EURCNY pair moves above the Kumo.

Short EUR/CNYThe recent increased expense ratio on short trades on the CNY-RMB will naturally push the value of the Chinese currency up versus the EUR and USD. A quick trade for a quick 1/5-2%.


"A Complete Mess" - Chinawww.zerohedge.com
Looking at ideas on how to play a potential China meltdown

Elliott wave analysis on EURCNY (2017-01-08)EURCNY might have finished the decline from 11.273 to 6.5158. In the long run it should retrace back to around 8.89.
Good luck for everyone!
