Dax 4hour : all eye on 14800 supportas i predict in low, dax flyup and can go upper now...if you have sell you must put SL on new high
above green arrow after pinbar we must buy and hold to high
good luck
alert: trade dax, other index need minimum 5 year trade on demo ,,, if you dont have 5 year practice on demo dont trade them
FDXM1! trade ideas

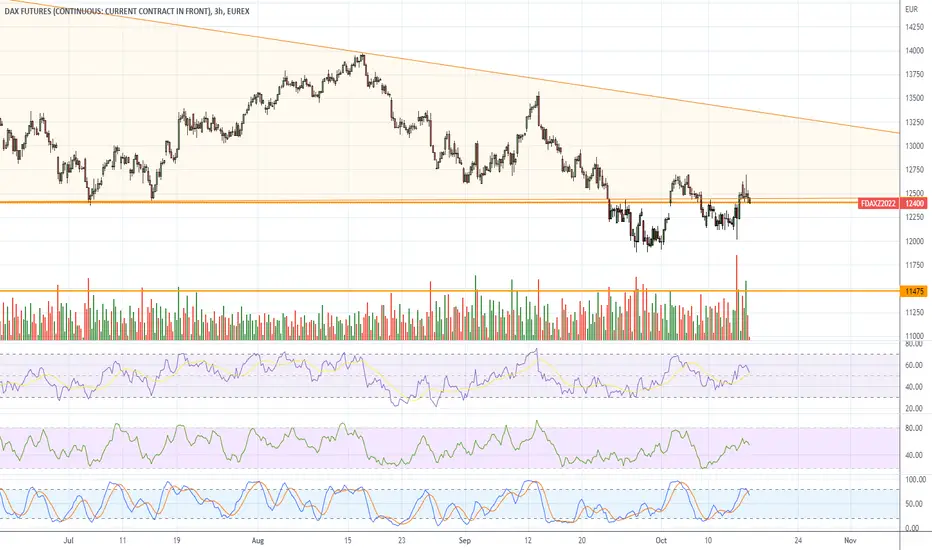
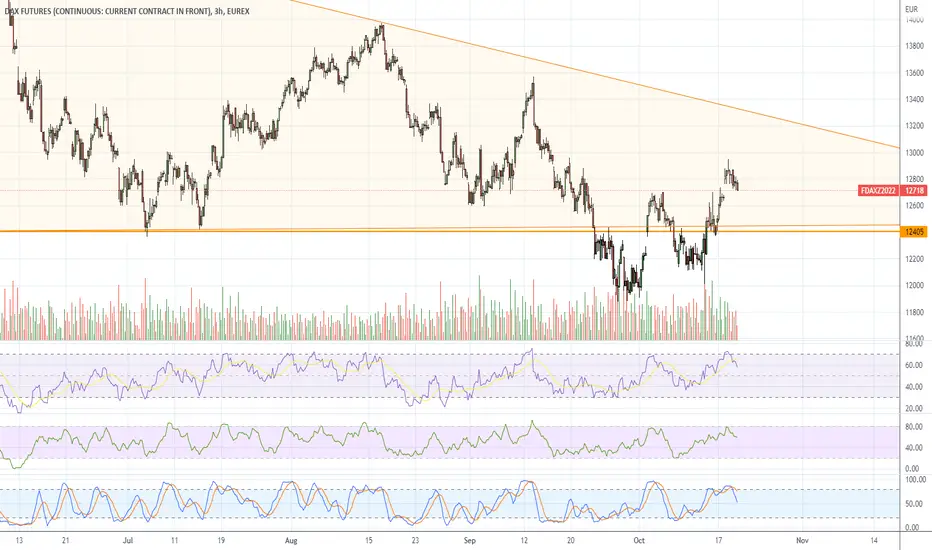
FDAX UpdateNot only overbought on the 3 hr chart, but way overbought on daily.
US market appears to be starting a 4 day short squeeze so not gonna short anything yet,.

DAX: Push itIt's not a struggle for the German index! The DAX index used all its willpower to find its way up and pushed all the way to climb above the resistance at 13 970 points. We're currently observing an upwards slope that should steadily move into the pink zone between 14 346 - 14 687 points. As soon as the blue wave completes its movement, the trend should turn into a downwards slope heading to the resistance at 13 970 points. If the DAX can't keep its upwards trend going, there's a 35% chance for the trend to cross the support at 13 036 and drop below 11 829 points into the green zone. We'll keep you posted on whether the DAX can keep up with its hard work or if it slams on the brakes.

IMPORTANT BREAKOUT - Opportunities in SMALL CAPSThe price made a significant move, breaking out of the channel of lower highs it was forming during the year. Probably will see a retest, before climbing higher. Next resistance between 14000 - 14700.
European markets already capitulated, although the S&P 500 hasn't yet.
The European Economy's future doesn't look bright.
Nevertheless, I think that the market already priced these risks.
Exciting opportunities in Small Caps in Europe.
Do not follow the crowd, be OPEN-MINDED, and be CONTRARIAN.
Good luck with your investments.

FDAX UpdateDouble tapped into overbought territory, I doubt their market can melt up.
Possible gap down for US tomorrow, then the media will blame it on GOP winning elections, lol.
FDAX UpdateRSI hit overbought with MFI divergence and rolled over
This is going to put downward pressure premarket for a while
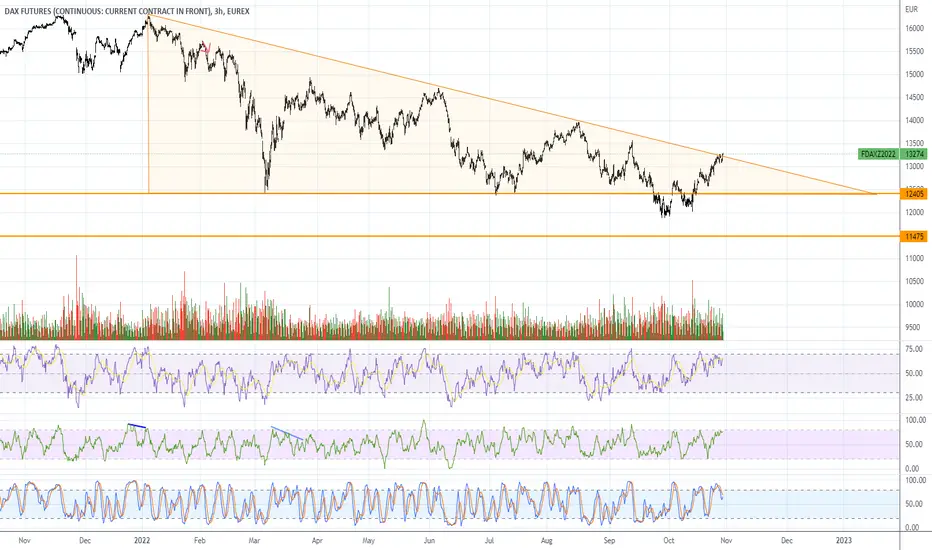
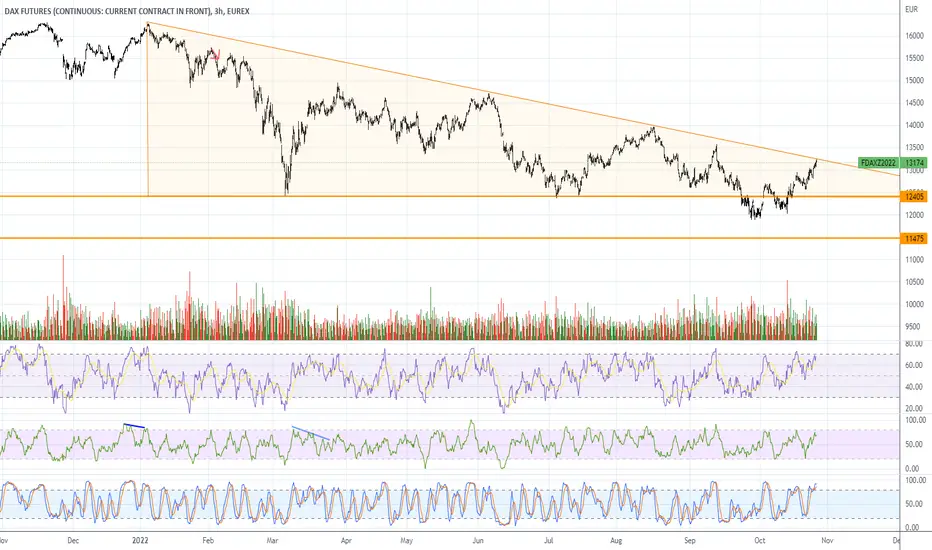
dax daily long term view : dax can start big +up trendline dax find a shape can start +up trend ...strangly advice above 13000 dont pick sell ... .90% looking for buy
in 2023 we can see dax in 19000 (fibo 161%)
secret : when dax go above EMA200 daily (big orange line), this mean +up trend start and pick sell is stupid
good luck

FDAX UpdateFDAX RSI almost overbought. Could see a reversal as soon as Monday.
So gap direction for Monday is a big question mark. If the market goes up Monday I might short something.
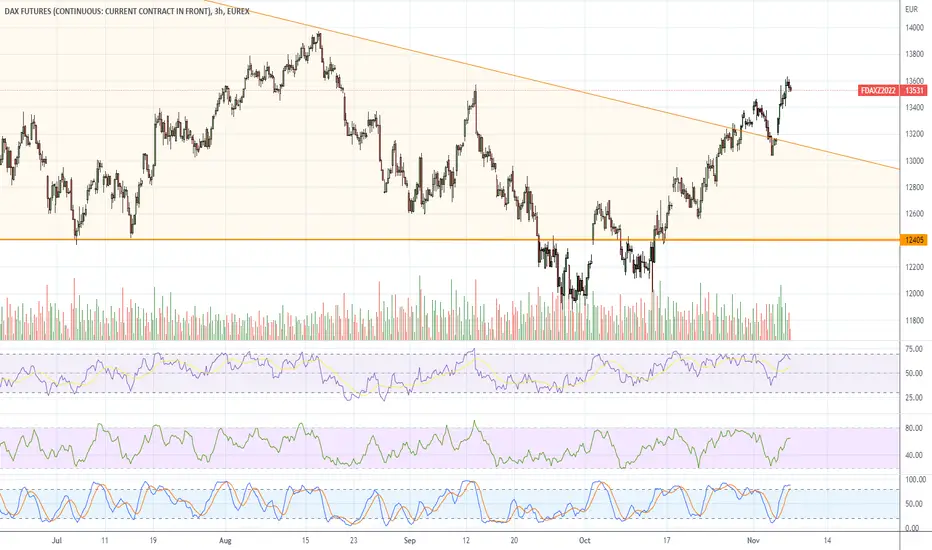
DAX Crucial 1D MA200 test! Sell with low risk but BUY if broken!The German stock index (DAX) has been trading within a Channel Up (Higher Highs/ Higher Lows) since the September 29 bottom. Following the contact with the 4H MA50 (blue trend-line) on Wednesday's Fed Rate Announcement, the price has been rebounding strongly, aiming at the 1D MA200 (red trend-line).
Having already broken above the January 05 Lower Highs trend-line last week, that would be the most crucial test for the long-term trend as the 1D MA200 has been unbroken since February 02, practically throughout the whole Bear Cycle of 2022. If broken, expect a Higher High on the Channel Up that would test the 13980 August 16 High (Resistance 1) where a 1W closing above it can target further upwards the 14710 June 06 High (Resistance 2).
Until the 1D MA200 break-out happens though, DAX's Channel Up draws heavy comparisons with the July 14 - August 16 Channel Up, which eventually topped and started a new heavy sell sequence that made the current market Low. As you see the top was formed after a 4H MA100/200 Bearish Cross (4H MA100 green trend-line crossing below the 4H MA200 orange trend-line), which is the pattern that DAX just formed today. On top of that, the 4H RSI sequences of the two Channel Up patterns are very similar following an (a)-(b)-(c)-(d) pattern. That means that until the price breaks and closes above the 1D MA200, being that close to it, we can take a low risk/ high reward sell and target the 4H MA200 (orange trend-line).
-------------------------------------------------------------------------------
** Please LIKE 👍, SUBSCRIBE ✅, SHARE 🙌 and COMMENT ✍ if you enjoy this idea! Also share your ideas and charts in the comments section below! This is best way to keep it relevant, support me, keep the content here free and allow the idea to reach as many people as possible. **
-------------------------------------------------------------------------------
You may also TELL ME 🙋♀️🙋♂️ in the comments section which symbol you want me to analyze next and on which time-frame. The one with the most posts will be published tomorrow! 👏🎁
-------------------------------------------------------------------------------
👇 👇 👇 👇 👇 👇
💸💸💸💸💸💸
👇 👇 👇 👇 👇 👇

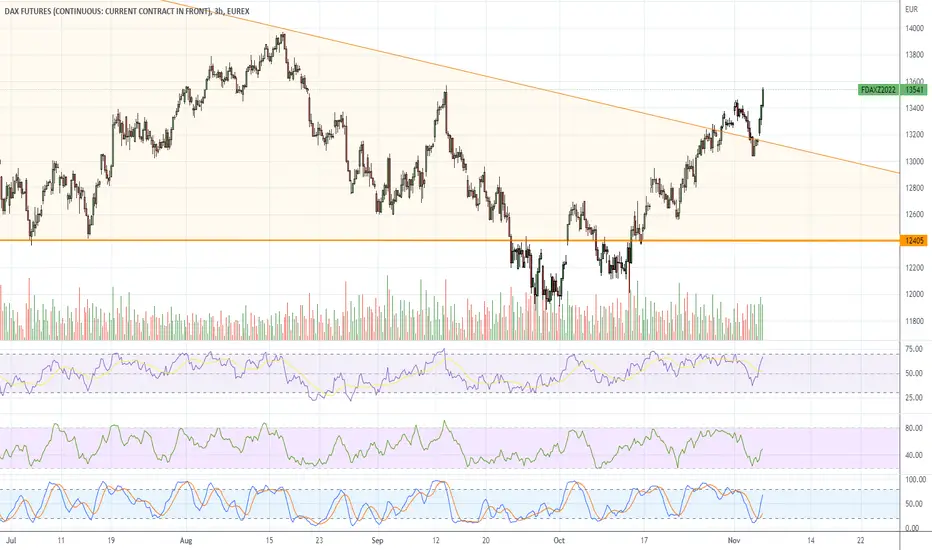
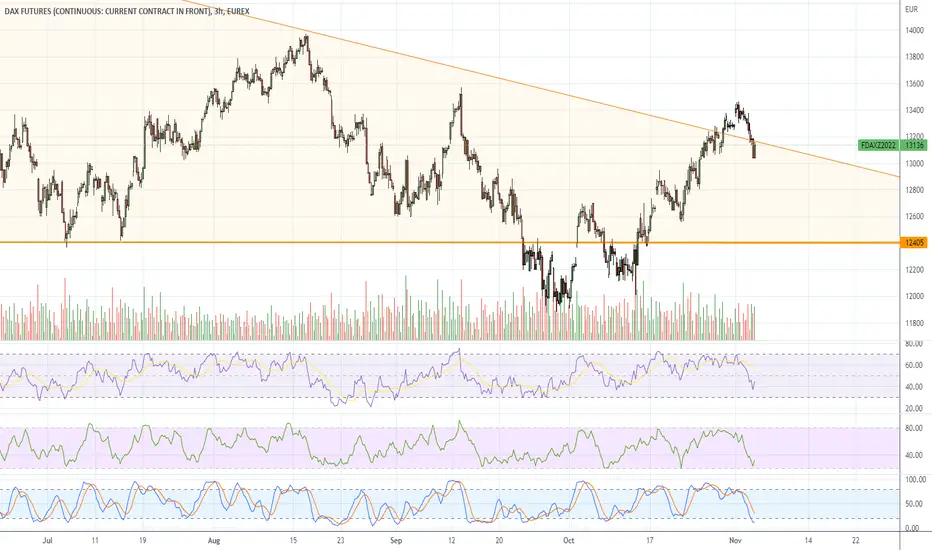
DAX: Bull flag breakout, or has the high been seen?The DAX is set to open lower, but there are two potential scenarios to monitor; a bullish breakout from a bull flag – or the swing high has already been seen around trend resistance.
The DAX has rallied from the September low in three waves, which could either be part of a new bullish trend or part of a 3-wave retracement. If we look at price action alone, the rally from 12,000 has been strong and a potential bull-flag is forming. Should we see prices break above 13,000 then we’ll assume the bullish trend is set to continue.
But there are two potential flies in the ointment which could scupper such a break higher. The rally has been seen on declining volumes, which suggests the ‘rally’ is corrective and not impulsive. Furthermore, the bull flag remains stuck beneath trend resistance. And given we recently saw a -bar reversal on the four-hour chart within the supposed bull flag, we are on guard for a break beneath yesterday’s low to assume bearish continuation.

FDAX UpdateIndicators neutral but MFI looks to be on the downtrend.
Fed pump dowesn't look very strong either. Could just be more whipsaw though
DAX 1hour :dax want touch EMA200 daily 13555 ?near arrow we can pick posation after pinbar comes
keep monitor AC indicator on 4hour chart
goodluck

FDAX UpdateThis is why I didn;t hold my long positions, FDAX is overbought...
US market appears to be melting up though, just staying cash
FDAX UpdateI think gap direction will be dictate by META earnings, not b the Euros, but in any case, the Euros look just about done
DAX 4hour : dax can reach 14500 , be careful from sellin coming hour dax little must go down but trend will remain up
in my idea when pinbar come pick buy and hold it 7-8 day to minimum EMA200 daily 13500
only under red allow we must pick sell after pinbar comes on 1hour or 4hour or daily chart
good luck


FDAX UpdateChina ate shit but the European algos still trying to pump. Hilarious ensues.
Pretty much every company that does business is tanking on TSLA cutting prices in China.
Even if the Euros pump again tomorrow morning, I see them dumping right after,

FDAX UpdateOK, I figured out why the market is pumping. FDAX MFI went oversold this morning, so the algos are indeed planning another pump and dump with the expectation that Europe will go up Monday.
I think it's being helped along by the fact that today is options expiration.

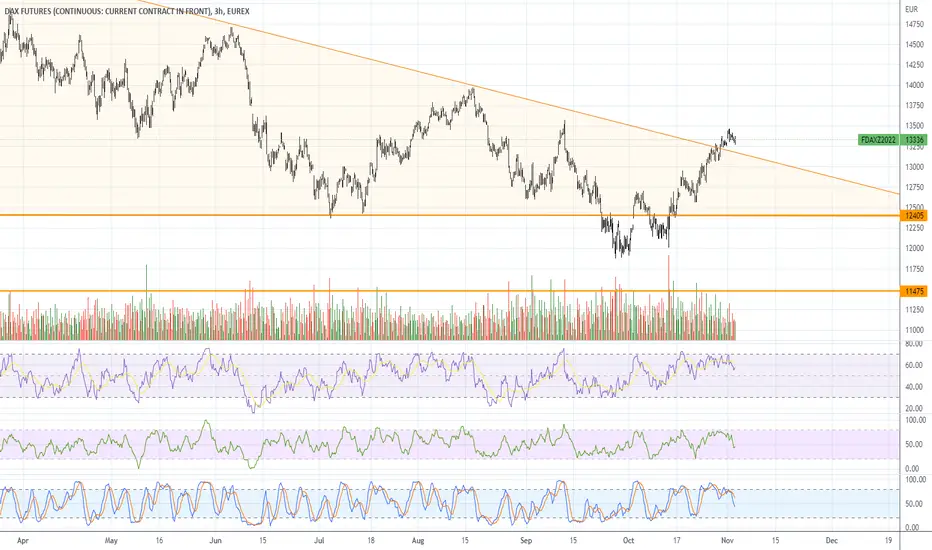
DAX Targeting The Daily Trendline In this update we review the recent price action in the DAX futures contract and identify the next high probability trading opportunity and price objective to target

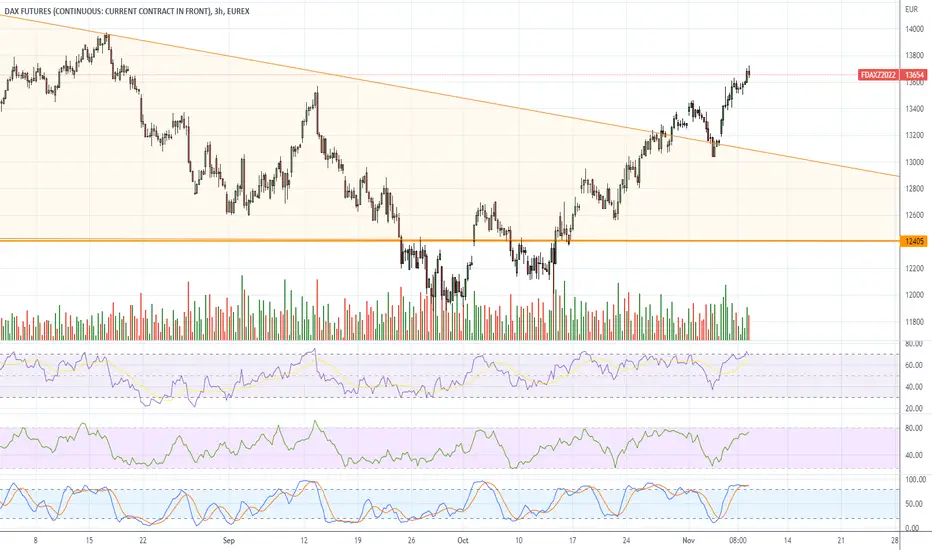
DAX Hit the 4H MA200 for the first time in +1 month.DAX (FDAX1!) hit today the 4H MA200 (orange trend-line) for the first time since September 14. This is still technically a short-term bullish reaction (Channel Up) within two longer term bearish structures (Bearish Megaphone with the dashed lines and Falling Wedge o a broader frame). With the 4H RSI approaching its Resistance Zone, it is not unlikely to see a rejection by tomorrow back to the 4H MA50 (blue trend-line).
We have accurately laid out this information on our previous DAX analysis 10 days ago:
Basically as it happened from July 19 to August 12, we may see continuous pull-backs on that Zone as the price breaks the Bearish Megaphone to test the top of the Falling Wedge. On the long-term only a closing above the 1D MA200 (red trend-line), which is untested since February 02, can be enough to change the trend from bearish to bullish.
-------------------------------------------------------------------------------
** Please LIKE 👍, SUBSCRIBE ✅, SHARE 🙌 and COMMENT ✍ if you enjoy this idea! Also share your ideas and charts in the comments section below! This is best way to keep it relevant, support me, keep the content here free and allow the idea to reach as many people as possible. **
-------------------------------------------------------------------------------
You may also TELL ME 🙋♀️🙋♂️ in the comments section which symbol you want me to analyze next and on which time-frame. The one with the most posts will be published tomorrow! 👏🎁
-------------------------------------------------------------------------------
👇 👇 👇 👇 👇 👇
💸💸💸💸💸💸
👇 👇 👇 👇 👇 👇

FDAX UpdateFDAX shows no indication for gap direction Monday.
Sentiment is obviously bearish, if they gap it up I think the gap fills quickly. the only reason to gap it up would be so the algos can sell at a higher price, this was obviously a pump and dump.