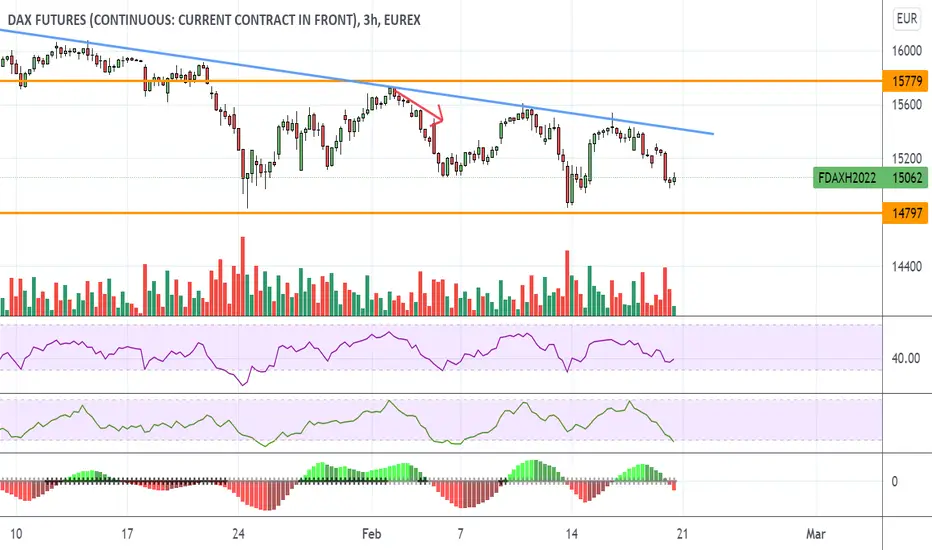
Trading The ABC Pattern In The DaxIn this update we review the recent price action in the DAX (futures contract) and identify the next high probability trade location and price objective to target.
FDXM1! trade ideas

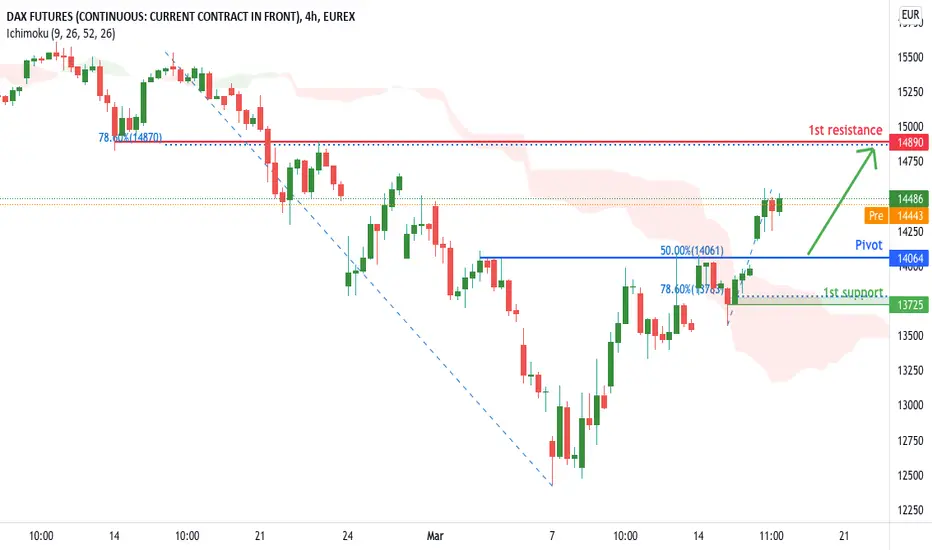
Dax Futures (FDAX1!), H4 Potential for a rise!Type: Bullish rise
Resistance : 14890
Pivot: 14064
Support : 13725
Preferred case: We see the potential for a further bullish rise from our Pivot at 14064 in line pullback support and 50% Fibonacci retracement towards our 1st resistance at 14890 in line with the pullback resistance and 78.6% Fibonacci retracement. Our bullish bias is further supported prices trading above our ichimoku cloud.
Alternative scenario: If prices were to reverse, they can potentially drop towards our 1st Support at 13725 which is in line with the swing low support and 78.6% Fibonacci retracement.
Fundamentals: With the concerns over the war in Ukraine, European stocks are expected to trade lower.
DAX Approaching the 1D MA50. Key for the recovery.The German Index has made a +17% rebound since last Monday's bottom and is very close to test the 1D MA50 (blue trend-line). That is the natural Resistance for the index as it has been unbroken since January 20th.
In a similar situation after the U.S. elections of November 2020, DAX started the strong uptrend of 2021 once it broke above the 1D MA50. It's first stop was the 1.236 Fibonacci extension level. On the current fractal that Fib is around 17200 and can be hit by June.
--------------------------------------------------------------------------------------------------------
Please like, subscribe and share your ideas and charts with the community!
--------------------------------------------------------------------------------------------------------

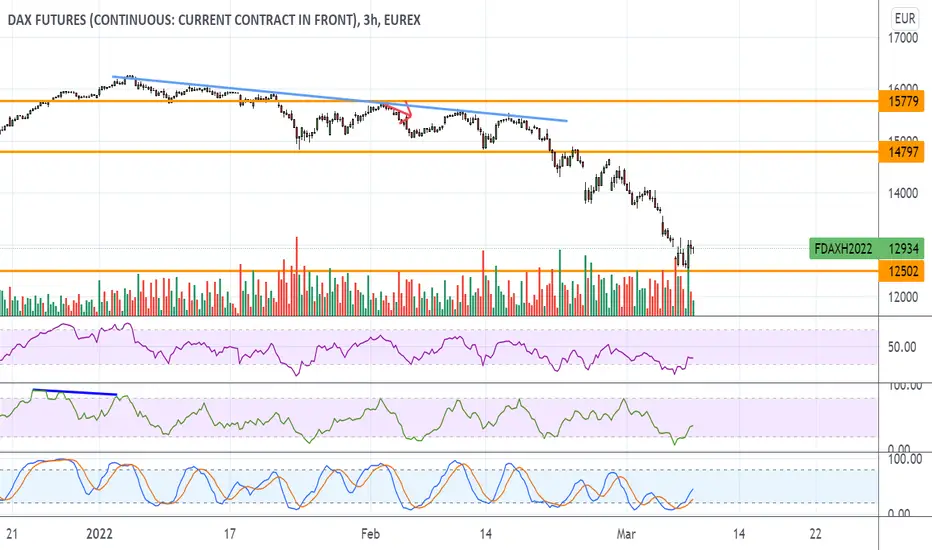
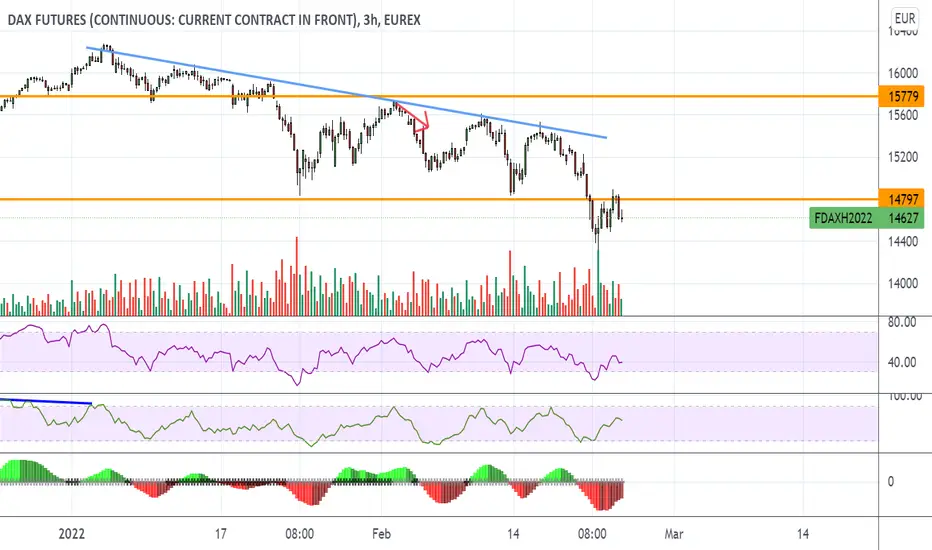
Dax Futures (FDAX1!), H4 Potential for dip!Type: Bearish drop
Resistance : 14644
Pivot: 14099
Support : 12558
Preferred case: We see the potential for a further bearish drop from our Pivot at 14099 in line swing high resistance and 78.6% Fibonacci retracement towards our 1st support at 12558 in line with the swing low support. Our bearish bias is further supported prices trading below our ichimoku clouds .
Alternative scenario: If prices were to reverse, they can potentially climb towards our 1st resistance at 14644 which is in line with the swing high resistance.
Fundamentals: With the concerns over the war in Ukraine, European stocks are expected to trade lower.

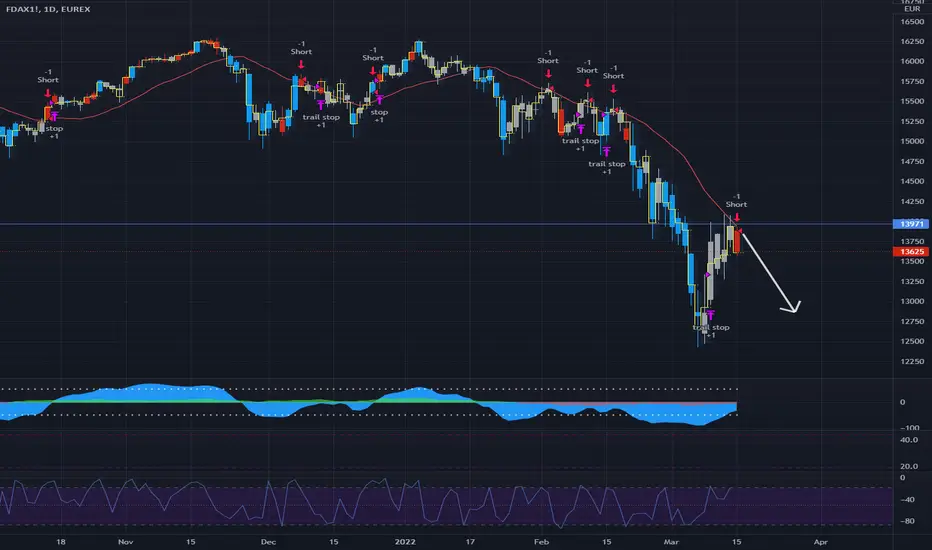
FDAX also triggered a PercentR short tradeno rally up to 18 moving average on the US markets last week, but on the german DAX index we had a bigger rally.
i try no to short the market with a trailing stop above prior days high.
DOW is also short from 33333 (above last inside day)
DAX try fill 3nd gap in 14666break high or touch EMA200 1hour (green line) have powerful buy but with SL under support
if you have Sell , 100% put SL on high (break high, can fly up dax to 15000 area
keep monitor AC accalator occilator on 30min chart and 4hour chart

DAX: Step by Step🪜Currently, DAX is neatly following the step-by-step plan we calculated for it. The index has touched at the white strip between 13404 and 13225 points and has already started to move upwards, crossing 13782 points. Although it could still go back into the white strip more strongly to complete wave (4) in white, it could be finished with it just as well and could directly continue its way to the upper white zone between 14319 and 14589 points. To achieve this scenario, though, DAX must not fall below 12425 points. Otherwise, it would have to make a detour through the lower green zone between 12074 and 11776 points first. There is a 30% chance that this alternative scenario could come true.

DAX | Significant Resistance at 13500-1400013500-14000 has capped the market for four consecutive years (2017, 2018, 2019, and 2020). In 2021 DAX finally broke the level and now is falling back below 13500. This means heavy fall of the market is ahead.

dax next target is EMA200 daily(big orange line) in 15000if you have buy , dont panic , trend will + up soon , today pullback is normal (AC accelator occilator 4hour is red)
+ up trend will start soon (if big bad news not come)
advice = looking for buy with low size and SL = today low (last low) and wait 7-8 day minimum to fibo 61%=14800
personaly i will keep my buy to 16000 (can take 2 month) in weekly chart dax up target fibo 161% show 17200 !!!!!
if you have old open sell , close 50% now and put sl on yesterday high ,ok?
ALERT= if low near 12400 break , dax can go to 12000(need big bad news) 12000 is best place for buy and hold to high (can take 30 day)
above condition(buy now) is valid on nasdaq,dow,sp500 too , they have buy too ,,, but + up trend always have many zigzag,mini crash
wish you win , 100% put SL under support or 40 point

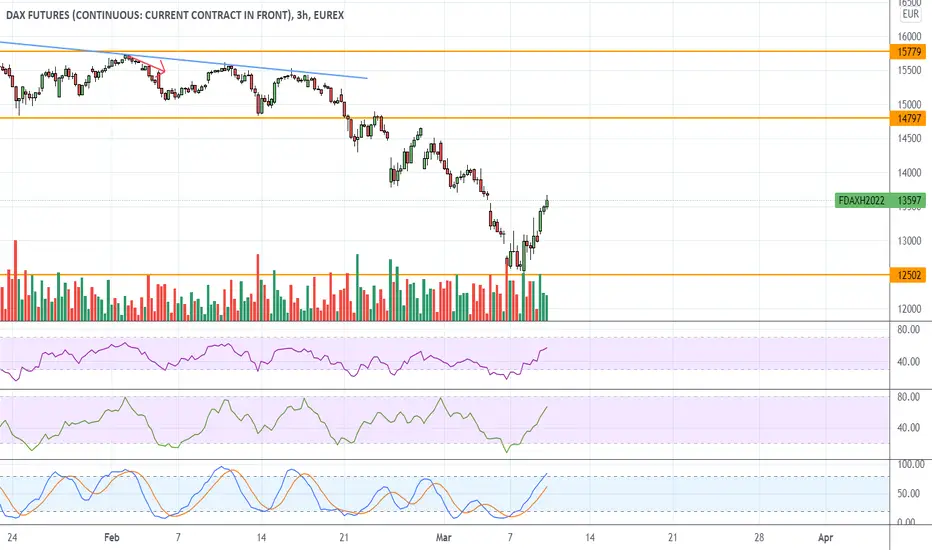
FDAX UpdateHuge pump, much bigger than I expected otehrwise I would have gone long, lol.
In any case, not overbought yet, looks like tomorrow
DAX | Short Position OpportunityAfter the initial European indices including DAX fall, market is now rebounding and there is a reaction to 13800. Sell on failure at this level.

FDAX UpdateFDAX went oversold on RSI and MI, so high gas prices or not, their algos have to pump. Not expecting a gap down any time this week and bailed out of my puts this morning on the dip.
Even if the US market goes down, it would have to do it mid-day. Might take a few days off until FDAX is done pumping, no desire to hold long positions overnight.
Trading The Bearish Dax SequenceIn this update we review the recent price action in the German Dax (futures contract) and identify the next high probability trading opportunity and price objectives to target.


buy little size dax and hold it minimum 15 day dax touch 12500 powerfull support (see weekly chart) now it must going fill friday gap
pick low size buy (per 1000$ balance 0.01 lot or 10$) with SL in pinbar low (after 80 point profit,move sl to open price, then let it go up)
please dont close your buy soon , dax after zigzag and minicrash can back to 16000 !!!!!!
personaly i want hold my buy near 2-3 month
note= if you are in CFD you can find it in INDEX folder with these symbol = FDAX -DAX -Germany40
DE30 - DE40

DAX Futures: Broadening + Head & Shoulders + WedgeIt is a small wedge but could confirm the bearish head and shoulders pattern, and thus anticipate the bearish breakout of the Broadening
1/3 position, 0.33%

DAX: “Drop It Like It’s Hot” It seems like DAX has been listening to Snoop Dogg far too much, because it has plunged into the magenta zone between 14392 and 13805 points, as if to say “Drop it like it’s hot”. However, we expect DAX to pop out of the magenta zone again “like it’s hot”. It should then rise back above the support at 14795 points and aim for the resistance at 16295 points from there. Still, a 45% chance remains that DAX could drop below 13805 points instead and fall until the bottom of the turquoise zone between 13951 and 13227 points before making it upwards again.

FDAX UpdateLooks like it backtested support. Indicators are neutral so it can go either way, but damn it looks bearish.
Remember Europe dictates the gap. Wasn't a big gap this morning because Europe was doing a retrace from the Monday morning drop.

Russel Leading The DaxIn this update we review the price action in the Dax & the Russell and identify the next high probability trading opportunity and price objectives to target.

FDAX UpdateSo FDAX did go oversold on RSI, taking US futures with it. Odd that Europe suddenly cares about Ukraine after ignoring it so far. Seems like it should've tanked last week, lol.
Anyways, RSI oversold with positive MFI divergence but at the same time FDAX broke support.
Safe play would be to short the rebound I think, not sure how far up it will go. Market will trade on Ukraine news, gonna be hard to predict.