EURGBPRSI indicates Bullish Divergence. Which means that at any time the market trend can change to HH and HL.
EURGBP.P trade ideas

BUY EURGBP for bearish trend reversal STOP LOSS : 0.8295BUY EURGBP for bearish trend reversal
STOP LOSS : 0.8295
Regular Bullish Divergence
In case of Regular Bullish Divergence:
* The Indicator shows Higher Lows
* Actual Market Price shows Lower Lows
We can see a strong divergence on the MACD already and There is a strong trend reversal on the daily time frame chart.....
The daily time frame is showing strength of trend reversal from this strong level of Support so we are looking for the trend reversal and correction push from here .....
TAKE PROFIT : take profit will be when the trend comes to an end, feel from to send me a direct DM if you have any question about take profit or anything
Remember to risk only what you are comfortable with…….trading with the trend, patient and good risk management is the key to success here


EURGBP - How will BOE decisions affect the pound?The EURGBP currency pair is below the EMA200 and EMA50 in the 4H timeframe and is moving in its medium-term descending channel. In case of an upward correction due to the meeting of the Central Bank of England today, we can see the supply zones and sell within those zones with appropriate risk reward. Breaking the specified support range will pave the way for this currency pair to continue its decline
Britain’s Treasury Secretary, Reeves, stated that it is still too early to make changes to economic forecasts following the U.S. election. He also expressed confidence that trade flows between the UK and the U.S. will continue under Trump’s presidency, noting that during Trump’s previous term, the two nations had a strong and constructive relationship. Reeves showed optimism about Britain’s role in shaping the global economic agenda.
Meanwhile, the risk of a German government collapse appears more serious than ever. The German government has entered a new phase of political crisis that could potentially lead to the final breakdown of the ruling coalition.
Last Friday, a document from Germany’s Finance Minister, Christian Lindner, was leaked, outlining his plans for economic reform in Germany. This document analyzes the economic challenges facing the country and offers proposals, such as corporate tax cuts and increased working hours. With internal tensions peaking, the likelihood of government collapse has risen.
ECB Vice President De Guindos stated that the European Central Bank is committed to a data-driven, meeting-by-meeting approach and is increasingly confident in achieving the 2% inflation target. Goldman Sachs, in its latest report, has lowered its GDP growth forecast for the Eurozone in 2025 to 0.8%, down from the previous forecast of 1.1%. This revision was attributed to potential threats stemming from Trump’s tariff policies following his reelection.

EURGBP| ANALYSIS | SIDEWAYS PRICE ACTION !WE ARE LOOKING AT THE EURGBP TO REBOUND 0.83697
giving us 60 pip towards the upside
key support area 0.83091
if it breaks then we will see a bearish price action
a 50 pip downward moment
please manage your risk if you agree with my idea do not trade blindly
always trade responsibly . don't rush market will always give you an opportunity

EUR_GBP POTENTIAL LONG|
✅EUR_GBP will soon retest a key support level of 0.8294
So I think that the pair will make a rebound
And go up to retest the supply level above at 0.8350
LONG🚀
✅Like and subscribe to never miss a new idea!✅

EUR_GBP Risky long BUY
EUR_GBP Fall down sharply and the pair will soon
Hit horizontal support of 0 8295 from where qa local bullish correction will follow soon
BUY

EUR-GBP Risky Long! Buy!
Hello,Traders!
EUR-GBP fall down sharply
And the pair will soon
Hit a horizontal support
Of 0.8295 from where a
Local bullish correction
Will follow soon
Buy!
Like, comment and subscribe to help us grow!
Check out other forecasts below too!

EUR/GBP Near 1-Year Low: Key Buy OpportunityHello,
EUR/GBP is likely to test the 0.830114 level again, approaching the 1-year low of 0.82950. This could present a strong buying opportunity if timed effectively!
No Nonsense. Just Really Good Market Insights. Leave a Boost
TradeWithTheTrend3344

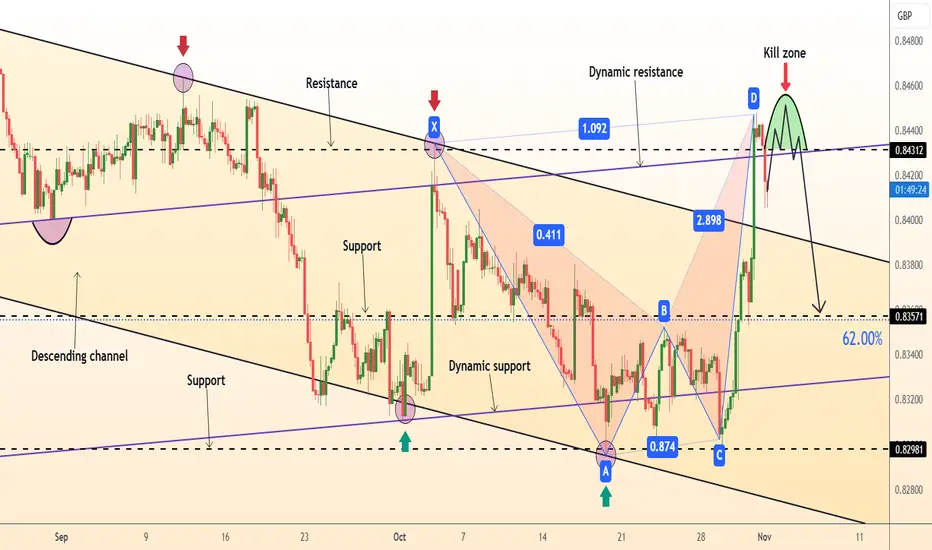
DeGRAM | EURGBP reversal patternEURGBP is above the descending channel between the trend lines.
The chart has broken the descending structure, but also formed a reversal harmonic pattern.
The price has already reached the resistance level and the upper trend line.
We expect a correction.
-------------------
Share your opinion in the comments and support the idea with like. Thanks for your support!
Sell EUR/GBP Channel BreakoutThe EUR/GBP pair on the M30 timeframe presents a potential selling opportunity due to a recent downward breakout from a well-defined Bearish Channel pattern. This suggests a shift in momentum towards the downside in the coming Hours.
Key Points:
Sell Entry: Consider entering a short position around the current price of 0.8392, positioned close to the breakout level. This offers an entry point near the perceived shift in momentum.
Target Levels:
1st Support – 0.8340
2nd Support – 0.8305
Stop-Loss: To manage risk, place a stop-loss order above 0.8422. This helps limit potential losses if the price unexpectedly reverses and breaks back upwards.
Your likes and comments are incredibly motivating and will encourage me to share more analysis with you.
Best Regards, KABHI FOREX TRADING
Thank you.

EURGBP pt 1Looks like a clean setup in my book, following my trading plan that is. I gave price some room to breathe with the stop loss making it under some of the previous lows. I'm looking for price to continue it's bullish movement.

EUR/GBP - Clear Bearish Momentum in Play --- ENTER NOWEUR/GBP has hit a clear daily trendline and was bullish in the short-term, however, it appears the bullish move is over and will continue its bearish descent. This is an easy 1:2 RR trade if you enter now. This is very likely to occur and will be risking a little more on this type of set up.

eurgbp can risehi traders
eurgbp had rejection from strong support level
and break a weekly resistance
now im waiting for price to rise around 0.84170
if price will break this level the next target will be touch

Stuck in the Triangle? EUR/GBP's About to Break FreeAlright, let’s break down this EUR/GBP setup!
Looking at the daily, we see EUR/GBP recently had a strong bullish push, but now it’s hitting a bit of consolidation just above the daily support at 0.83950. That area has acted as a significant barrier before, so if price can stay above it, we might see another leg up. On the daily, the 21 EMA is below price, showing that buyers are still holding on, but it’s struggling to break out decisively above that 0.84242 level.
Switching down to the 4-hour, we can see that price is coiling up in a tight range, forming a triangle pattern. This setup is perfect for a breakout trade – we just need to see which direction it wants to move. If it breaks above the trendline around 0.84000, we could look for a buy, targeting the next resistance at 0.84242, and possibly higher if momentum kicks in. But if it breaks down below the 0.83950 support, then we’re likely looking at a sell with a target toward 0.83573.
So here’s the plan: wait for a solid breakout from this triangle pattern on the 4-hour. Look for an entry around the breakout area, keeping your SL just below the structure on either side. Remember, let the market show you the move; patience pays, especially with consolidation setups like this.

EURGBP LONG FOR 50PIPS1. Current Trend Analysis
If the pair is in an uptrend or showing signs of bullish momentum, a long position is more favorable.
Look for support levels near the entry point, such as recent lows or Fibonacci retracement levels, to provide a better base for a long position.
2. Entry and Exit Points
Entry: A good entry would be around a key support level where the pair has shown repeated rebounds, with a clear signal (such as a bullish candlestick pattern) indicating a reversal.
Take Profit: For a 50-pip target, select a level near a recent high or a resistance level that aligns with the uptrend, like a previous swing high.
Stop Loss: Place a stop loss below the support level or recent low (at least 20–30 pips below) to protect against a reversal.

EUR/GBP Short H4 " The Pound gaining pounds ?"Sell Limit @ 084534
S/L @ 0.84825
T/P1 @ 0.83700 (Tight Stop)
T/P2 @ 0.83060
R.R.R. @ 1/5
Seeing Impulse Bearish in construction of Minor Wave 3 has Minute Wave iv finish retracement on his way to Minute Wave v has first profit target. Sit tight !
Good Trading 👍


EURGBP to attract buyers at market price?EURGBP - 24h expiry
Yesterday's Marabuzo is located at 0.8412.
The primary trend remains bearish.
Preferred trade is to sell into rallies.
Trading has been mixed and volatile.
We look for a temporary move higher.
We look to Sell at 0.8412 (stop at 0.8434)
Our profit targets will be 0.8357 and 0.8347
Resistance: 0.8397 / 0.8420 / 0.8448
Support: 0.8369 / 0.8353 / 0.8340
Risk Disclaimer
The trade ideas beyond this page are for informational purposes only and do not constitute investment advice or a solicitation to trade. This information is provided by Signal Centre, a third-party unaffiliated with OANDA, and is intended for general circulation only. OANDA does not guarantee the accuracy of this information and assumes no responsibilities for the information provided by the third party. The information does not take into account the specific investment objectives, financial situation, or particular needs of any particular person. You should take into account your specific investment objectives, financial situation, and particular needs before making a commitment to trade, including seeking advice from an independent financial adviser regarding the suitability of the investment, under a separate engagement, as you deem fit.
You accept that you assume all risks in independently viewing the contents and selecting a chosen strategy.
Where the research is distributed in Singapore to a person who is not an Accredited Investor, Expert Investor or an Institutional Investor, Oanda Asia Pacific Pte Ltd (“OAP“) accepts legal responsibility for the contents of the report to such persons only to the extent required by law. Singapore customers should contact OAP at 6579 8289 for matters arising from, or in connection with, the information/research distributed.

EURGBP: Price Action Trading 🇪🇺🇬🇧
EURGBP can pull back from a key daily structure support.
A cup & handle pattern formation and a breakout of its neckline on a 4H
increase the probabilities that the price will go up.
Goal - 0.843
❤️Please, support my work with like, thank you!❤️

Check the trend According to the behavior of the price in the current support range, possible scenarios have been identified. As long as the price is above the support range, the continuation of the upward trend is likely

Could the price reverse from here?EUR/GBP is rising towards the resistance level which is a pullback resistance that is slightly below the 50% Fibonacci retracement and could reverse from this level to our take profit.
Entry: 0.8404
Why we like it:
There is a pullback resistance level that is slightly below the 50% Fibonacci retracement.
Stop loss: 0.8448
Why we like it:
There is a pullback resistance level.
Take profit: 0.8347
Why we like it:
there is a pullback support that is slightly below the 61.8% Fibonacci retracement.
Enjoying your TradingView experience? Review us!
Please be advised that the information presented on TradingView is provided to Vantage (‘Vantage Global Limited’, ‘we’) by a third-party provider (‘Everest Fortune Group’). Please be reminded that you are solely responsible for the trading decisions on your account. There is a very high degree of risk involved in trading. Any information and/or content is intended entirely for research, educational and informational purposes only and does not constitute investment or consultation advice or investment strategy. The information is not tailored to the investment needs of any specific person and therefore does not involve a consideration of any of the investment objectives, financial situation or needs of any viewer that may receive it. Kindly also note that past performance is not a reliable indicator of future results. Actual results may differ materially from those anticipated in forward-looking or past performance statements. We assume no liability as to the accuracy or completeness of any of the information and/or content provided herein and the Company cannot be held responsible for any omission, mistake nor for any loss or damage including without limitation to any loss of profit which may arise from reliance on any information supplied by Everest Fortune Group.

7 Dimension Sell Setup for EURGBP😇 7 Dimension Analysis
Top-Down View:
A daily internal swing breach indicates the possibility of a retracement to fill the Daily Fair Value Gap (FVG) area. Additionally, an H4 Change of Character (CHoCH) along with a major swing liquidity sweep suggests a move towards the H4 inducement area, which aligns with the H1 decisional order block and the Daily Bullish FVG, creating a robust buy Point of Interest (POI) for long-term entries. However, in this 15-minute analysis, we focus on the short-term bearish momentum for a counter-trend sell entry.
Analysis Time Frame: 15-Minute (15M)
Swing Structure:
Bullish with BOS (Break of Structure): The 15M structure is bullish with a valid BOS, which took an inducement to confirm a swing high.
Discount Zone: We’re waiting for the price to enter the discounted zone to mitigate the POI, which has been refined across multiple time frames. The target area is between 0.8340 and 0.8420, where liquidity is expected to be resting.
Pattern:
🟢 Chart Patterns:
Flag Pattern: An H1 flag pattern indicates strong sell-side momentum, reinforcing the idea of a retracement within this bullish structure.
🟢 Candle Patterns:
Momentum Candles: Strong momentum candles closing bearishly indicate solid selling pressure in the area of interest.
Volume:
A noticeable increase in volume on the last candle suggests significant interest from sellers, supporting a bearish bias in the short term.
Momentum (RSI):
🟢 Super Bearish Zone: Momentum is in the super bearish zone with a clear range shift, indicating that bearish pressure may continue in the immediate term.
Volatility (Bollinger Bands):
🟢 Contraction and Squeeze: Following a volatile move, price contraction has led to a tight squeeze on the bands. A clear “M” pattern has formed within this squeeze, and we now expect a continuation of bearish momentum with a “walking on the band” move on the downside.
Strength (ROC and DMI):
ROC and DMI Analysis: The Bearish DMI line is sharply increasing, indicating strong bearish momentum. The setup suggests an anticipated strong selling attempt as the market opens.
Rating: ⭐⭐⭐⭐
Probability: 75%
Overall, the analysis provides high confidence in a short-term pullback, with several technical indicators and patterns supporting a temporary bearish move.
Trade Setup:
Entry Details:
Entry Time Frame: 15-Minute
Entry TF Structure: Bullish (counter-trend)
Point of Interest (POI): Recent Order Flow
Trade Execution:
💡 Decision: Sell Limit
🚀 Entry: 0.8379
✋ Stop Loss: 0.8391
🎯 Take Profit: 0.8340
😊 Risk to Reward Ratio: 3.25 RR
🕛 Expected Duration: 1 Day
SUMMARY:
This short-term sell setup targets a counter-trend pullback within a larger bullish structure on the higher time frames. With multiple confluences including strong sell-side volume, bearish flag patterns, and clear RSI bearish momentum, this setup anticipates a retracement to the identified support zone. A Sell Limit order at 0.8379 seeks to capture the downside move towards 0.8340, offering a favorable 3.25 RR.
