EURGBP Technical & Order Flow AnalysisOur analysis is based on a multi-timeframe top-down approach and fundamental analysis.
Based on our assessment, the price is expected to return to the monthly level.
DISCLAIMER: This analysis may change at any time without notice and is solely intended to assist traders in making independent investment decisions. Please note that this is a prediction, and I have no obligation to act on it, nor should you.
Please support our analysis with a boost or comment!
EURGBP trade ideas

EURGBP Hits SupportEURGBP Hits Support
EUR/GBP declined steadily below the 0.8440 and 0.8430 support levels.
Important Takeaways for EUR/GBP Analysis Today
- EUR/GBP is trading in a bearish zone below the 0.8450 pivot level.
- There is a connecting bullish trend line forming with support at 0.8415 on the hourly chart at FXOpen.
EUR/GBP Technical Analysis
On the hourly chart of EUR/GBP at FXOpen, the pair started a fresh decline from well above 0.8460. The Euro traded below the 0.8440 and 0.8430 support levels against the British Pound.
The EUR/GBP chart suggests that the pair even declined below the 0.8420 level and tested 0.8415. It is now consolidating losses and trading below the 50-hour simple moving average. However, there is a connecting bullish trend line forming with support at 0.8415.
The pair is now facing resistance near the 50% Fib retracement level of the downward move from the 0.8442 swing high to the 0.8416 low at 0.8430.
The next major resistance could be 0.8440. The main resistance is near the 0.8450 zone. It coincides with the 1.236 Fib extension level of the downward move from the 0.8442 swing high to the 0.8416 low.
A close above the 0.8450 level might accelerate gains. In the stated case, the bulls may perhaps aim for a test of 0.8480. Any more gains might send the pair toward the 0.8500 level.
Immediate support sits near 0.8415. The next major support is near 0.8405. A downside break below the 0.8405 support might call for more downsides. In the stated case, the pair could drop toward the 0.8380 support level.
This article represents the opinion of the Companies operating under the FXOpen brand only. It is not to be construed as an offer, solicitation, or recommendation with respect to products and services provided by the Companies operating under the FXOpen brand, nor is it to be considered financial advice.


EurgbpEurgbp is on a uptrend so we are trading with de trend and not against the trend but we are expecting a retracment back to the zone then we buy
EUR/GBP...BUYPrice is currently creating a head & shoulders reversal pattern and according to the COT report the buyers are stepping in this week so we might see a trend change.

EUR/GBP - A symmetrical triangle breakout to the downside
On the 30 minute chart we observe a symmetrical triangle that broke out on the downside on high volume. The price objective for a triangle is the distance of the widest 2 points of the triangle, projected in the direction from the breakout point.
On the chart we can see that the price objective is about 34 pips. A trade is placed near the breakout point, projected around 34 pips downward. I placed this trade before the breakout occurred, with my reasoning being this symmetrical triangle will breakout in continuation of the current trend which is downward. I did not expect the breakout to occur on the upside.
The price objective hasn't be met yet, which gives me reason to stay in the current trade until it has, or until new technical patterns arise.

Price action Gbpeur broke structure to the upside came to collect some liquidity now targeting a low with some liquidity will see from there what the market does

possibility of uptrendIt is expected that a trend change will form within the current support line and we will see the start of an uptrend. If the price breaks through the support line, the downtrend will continue.

EURGBP Potential H&SI´m following a potential reversal for EURGBP as a Head and Shoulders pattern.
Neckline break at 0.845 would take us to the next strong resistance level at 0.853.
Bullish RSI divergence is supportive of this scenario.

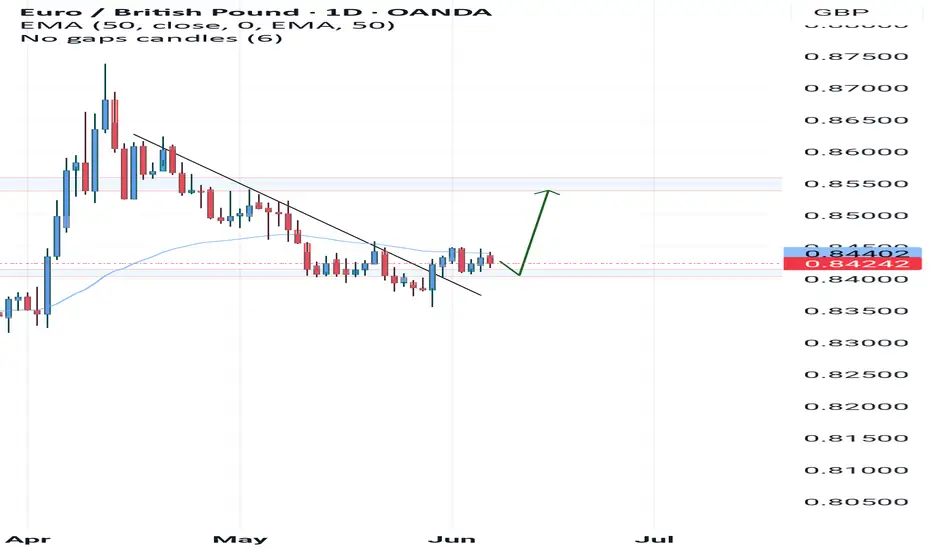
EURGBPKey resistance levels on the chart:
– 0.8715
– 0.8800
Price is currently in a sideways range after a long downtrend, showing signs of stabilization above a previous support zone
Trading idea: watch how price reacts to 0.8620
A breakout and close above it signals a move toward 0.8715
Rejection could lead to a retest of the recent low near 0.8350

EURGBP Just a few minutes ago, the AUDUSD trade I shared closed in profit — now it's time to look at the next opportunity. One of those is a sell setup on the EURGBP pair.
🔍 Trade Details
✔️ Timeframe: 15-Minute
✔️ Risk-to-Reward Ratio: 1:2
✔️ Trade Direction: Sell
✔️ Entry Price: 0.84149
✔️ Take Profit: 0.84106
✔️ Stop Loss: 0.84170
🔔 Disclaimer: This is not financial advice. I’m simply sharing a trade I’ve taken based on my personal trading system, strictly for educational and illustrative purposes.
📌 Interested in a systematic, data-driven trading approach?
💡 Follow the page and turn on notifications to stay updated on future trade setups and advanced market insights.

ECB Rate Cut Expected – Implications for EUR TradingThe European Central Bank (ECB) is widely expected to cut interest rates by 25 basis points today, bringing the deposit rate from 2.25% to 2.00%. This marks the first rate cut since 2019 and is a clear signal that the ECB is shifting from its aggressive inflation-fighting stance toward more growth-supportive policy.
Why It Matters for EUR Traders:
Rate Cut = EUR Bearish (Generally)
Lower interest rates typically reduce the appeal of a currency. A cut to 2.00% narrows the rate differential between the eurozone and other central banks like the Federal Reserve, which is currently holding rates steady above 5%. This can pressure the euro lower against major counterparts like USD and GBP.
Market Already Priced In – Limited Downside?
The market has largely priced in today's rate cut, so the forward guidance and tone of the press conference will be more crucial than the rate move itself. If President Christine Lagarde signals a slower path of further cuts, that could support the EUR by dampening expectations of rapid easing.
Divergence with Fed & BoE
The ECB is easing while the Federal Reserve and Bank of England remain cautious. This divergence in policy paths may weigh on EUR/USD and EUR/GBP, especially if U.S. labor data or UK inflation surprises to the upside.
Inflation Still Sticky in Services
Despite headline inflation falling, services inflation remains elevated, making some ECB policymakers hesitant about further cuts. If the ECB stresses this concern today, EUR could see short-term strength as traders scale back aggressive easing bets.
Eurozone Growth Concerns
Slowing economic activity, particularly in Germany and Italy, supports the case for easing. However, if the ECB cuts but sounds cautious about future moves, EUR/USD may stabilize or rebound as dovish expectations are re-evaluated.
EUR Trading Scenarios
Dovish Cut (explicit talk of more cuts) → EUR likely weaker vs USD, GBP, and CHF.
Cautious/Done-for-now Tone → EUR could stabilize or strengthen, especially if market was positioned for more aggressive easing.
Surprise Hold (unlikely) → EUR likely spikes up sharply.

EUR/GBP BULLS WILL DOMINATE THE MARKET|LONG
EUR/GBP SIGNAL
Trade Direction: long
Entry Level: 0.837
Target Level: 0.843
Stop Loss: 0.832
RISK PROFILE
Risk level: medium
Suggested risk: 1%
Timeframe: 9h
Disclosure: I am part of Trade Nation's Influencer program and receive a monthly fee for using their TradingView charts in my analysis.
✅LIKE AND COMMENT MY IDEAS✅

The Day Ahead Economic Data Releases
United States
April trade deficit widened.
Initial jobless claims due today.
ISM Manufacturing PMI for May remains below 50, indicating contraction.
China
Caixin Services PMI (May): 51.1 (up from 50.7).
Composite PMI fell to 49.6, showing overall contraction.
Japan
May Manufacturing PMI: 49.4 (up from 48.7), slower contraction.
Germany
April factory orders and May construction PMI due today.
Italy
April retail sales due.
Eurozone
April Producer Price Index (PPI) due.
Canada
April international merchandise trade data due.
Sweden
May Consumer Price Index (CPI) due.
Central Banks
Federal Reserve: Speeches by Kugler and Harker.
European Central Bank: Interest rate decision expected today.
Bank of England: Greene and Breeden to speak; DMP (Decision Maker Panel) survey release.
Earnings
Broadcom (AVGO): Shares recently up 1.67%.
Lululemon (LULU): Shares recently up 0.11%.
This communication is for informational purposes only and should not be viewed as any form of recommendation as to a particular course of action or as investment advice. It is not intended as an offer or solicitation for the purchase or sale of any financial instrument or as an official confirmation of any transaction. Opinions, estimates and assumptions expressed herein are made as of the date of this communication and are subject to change without notice. This communication has been prepared based upon information, including market prices, data and other information, believed to be reliable; however, Trade Nation does not warrant its completeness or accuracy. All market prices and market data contained in or attached to this communication are indicative and subject to change without notice.

EURGBP 4H Short Setup 📘 Educational Caption for Your Trading Chat
🟥 EURGBP 4H Short Setup (Smart Money Strategy)
I'm in a short position on EURGBP from the 0.84342 level after a strong mitigation of the Order Block (O-B) and a bearish reaction, indicating possible distribution.
📉 Entry: 0.84342
🎯 Target: 0.83564
🛡️ Stop Loss: 0.84583
⚖️ Risk-Reward: ~1:3 — favorable setup with high reward potential
This setup reflects Smart Money Concepts (SMC) — price tapped into a previously defined supply zone (O-B), rejected, and is now showing signs of downward momentum. We also have clear structural confluence with previous BOS and liquidity buildup.
🔔 Note: Patience is essential. Stick to your plan and manage the trade with discipline as price develops.
⚠️ Disclaimer: This trade is shared for educational purposes only. Do your own analysis and use proper risk management. Not financial advice.

THE FLEX SETUP (EURGBP)Good day traders, I'm back with another setup and it’s only an update that I believe can really provide insight into what to expect from price in the upcoming weeks.
Like I always say that I always want to see price take out a previous week high/low as I use that as a confirmation in term of the power of 3 that I use to try and avoid manipulation, but this doesn't mean I don't get on the wrong side of price moves. Looking at the HTF's overall structure we can see that we in a very bullish structure but... There's a bearish flow in price!! On the weekly TF price left a large FVG(BISI), showing how strong the bullish structure is and now that price is trading on top of this BISI I'm mentioning. If we go one TF lower to the daily TF than on the daily the weekly BISI is a balanced price range and normally how I look at Gaps after been balanced, I treat them like classic support/resistance, but they have to confluence with another PD array first than for me the rules of 'support/resistance' come into play. If you look close into the daily TF, we have relative equal highs inside the volume imbalance created on the 12th of May.
Let's look at how price delivered since opening with a gap lower on the 12th, on that same day price repriced that gap but did not close above it. Why do we want it to close above it? Well ICT teaches more on volume imbalances and the rules or pros and cons. If price closes above the volume imbalance than it becomes balanced once price retests the closure above/below obviously depending on the gap opening. On the 4HTF we saw price shift structure higher and the first thing I see is the candle that had a broken lower high because it also became our breaker. And a FVG inside it making that zone stronger again we can use all the PD arrays together.

EUR\GBP SellPrice hit major resistance leavel in down trend.And plus the COT report has more sellers on this pair.

EURGBP Is Very Bullish! Buy!
Take a look at our analysis for EURGBP.
Time Frame: 1D
Current Trend: Bullish
Sentiment: Oversold (based on 7-period RSI)
Forecast: Bullish
The market is testing a major horizontal structure 0.841.
Taking into consideration the structure & trend analysis, I believe that the market will reach 0.852 level soon.
P.S
Overbought describes a period of time where there has been a significant and consistent upward move in price over a period of time without much pullback.
Disclosure: I am part of Trade Nation's Influencer program and receive a monthly fee for using their TradingView charts in my analysis.
Like and subscribe and comment my ideas if you enjoy them!


PMI Divergence & ECB Rate Decision Looms:0.84 Key Level in PlayEURGBP 04/06 – PMI Divergence & ECB Rate Decision Looms: 0.84 Key Level in Play
EUR/GBP is hovering around the 0.8420 mark after mixed PMI releases from the Eurozone and Germany. Traders are cautiously awaiting the ECB’s interest rate decision this Thursday, while the Bank of England signals potential easing — but remains non-committal on timing.
🌍 MACRO OUTLOOK
Eurozone & German PMI:
Eurozone Composite PMI eased to 50.2, still above forecasts (49.5) but reflecting slowing momentum.
German Composite dropped to 48.5; Services fell further to 47.1 — signaling contraction risk in Europe’s largest economy.
ECB Dovish Expectations:
Core inflation fell to 1.9% YoY in May — below the 2% ECB target for the first time in eight months.
Markets are fully pricing in a 25bps rate cut this week.
BoE Shifts Cautiously Dovish:
Governor Andrew Bailey acknowledged that monetary easing is likely, but warned of "uncertainty ahead."
The MPC is split — some fear sticky inflation; others warn that rates staying too high too long may damage growth.
Market Sentiment:
EUR remains pressured by ECB dovish expectations.
GBP is also under pressure from weak UK macro indicators and global trade tensions.
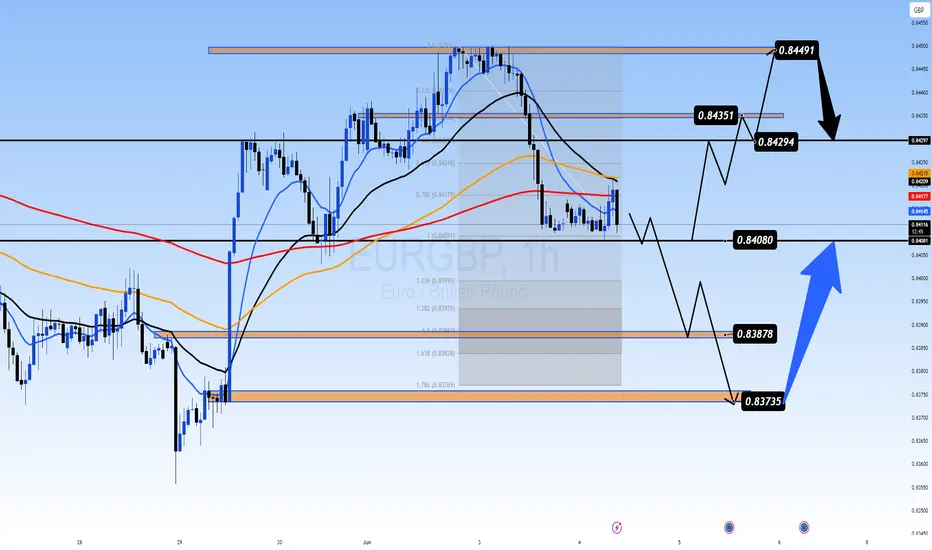
📉 TECHNICAL OUTLOOK (H1 Chart)
Price is consolidating near the EMA200 (0.8409) — a crucial dynamic support.
A tight sideways range has formed; 0.8408 is a key horizontal level to watch for breakout/breakdown confirmation.
Break below 0.8408 could send price toward Fibo 1.618 at 0.8383 or psychological support at 0.8373.
If bulls defend 0.8408, we may see a bounce toward 0.8429 → 0.8449 resistance zone.
🔑 KEY TRADE ZONES
🟢 BUY ZONE: 0.8380 – 0.8373
SL: 0.8358
TP: 0.8400 → 0.8415 → 0.8429 → 0.8435
🔴 SELL ZONE: 0.8448 – 0.8450
SL: 0.8460
TP: 0.8435 → 0.8420 → 0.8408 → 0.8388
⚠️ TRADE STRATEGY
Watch the 0.8408 area closely. If price holds → short-term BUY scalp opportunities.
If it breaks strongly → consider SELL toward lower Fibo/structure levels at 0.838x.
Be cautious around ECB release — avoid trading during the spike. Wait for structure confirmation post-news.
📌 CONCLUSION
"EUR/GBP is entering a critical zone near 0.8400. With ECB and BoE both leaning dovish, expect increased volatility. Hold or break at this key level will likely define the next directional leg. Stay patient and let the market show its hand."
EURGBP BUY FORECASTEUR/GBP – Technical Analysis (1H)
🔹 Current Price Zone: 0.8414
🔵 Market Structure & Trend
The market broke structure to the upside recently, forming a Higher High (HH) and Higher Low (HL), suggesting a bullish shift.
Price is currently retesting the previous breakout zone, which aligns with a demand zone (green box).
This area could serve as a bullish continuation entry, particularly if confirmed by bullish candlestick formations (e.g., engulfing or pin bar).
🟩 Demand Zones
Immediate demand zone around 0.8410 – 0.8400 is being tested (green box on your chart).
A deeper demand zone lies around 0.8375 – 0.8355, which aligns with a previous accumulation area.
🟥 Supply Zone / Resistance
Near-term resistance zone between 0.8460 – 0.8480 (red box).
Daily and 4H order blocks or imbalance may exist in this area.
✅ Buy Setup (Bullish Scenario)
Entry: 0.8405 (current demand zone)
Stop Loss: Below 0.8385 (outside demand zone)
Take Profit 1: 0.8460 (local high)
Take Profit 2: 0.8500 (psychological level)

EUR_GBP POTENTIAL LONG|
✅EUR_GBP will be retesting a support level soon at 0.8400
From where I am expecting a bullish reaction
With the price going up but we need
To wait for a reversal pattern to form
Before entering the trade, so that we
Get a higher success probability of the trade
LONG🚀
✅Like and subscribe to never miss a new idea!✅
Disclosure: I am part of Trade Nation's Influencer program and receive a monthly fee for using their TradingView charts in my analysis.

Very bearish A clear market manipulation on the monthly and a breakdown below the major zone. Followed by a daily bullish candle for a retest of the major zone. Now we have a bearish candle to continue the bearish leg down
