EurGbp | Short and then Long | Confirm Trends The BoE held interest rates as expected last month, but they did deliver a shock vote split. Three members of the vote-setting committee voted to cut rates by 0.25%, which was more than expected, with 6 voting to keep rates on hold.
The BOE’s statement that accompanied the decision also stressed the disinflation in the UK’s economy in recent years, and the weakness in the economy, along with the loosening in the labour market. The Bank noted the ‘two-sided risks to inflation’ but continued to say that a ‘gradual and careful approach’ to rate cuts remains appropriate.
EURGBP trade ideas

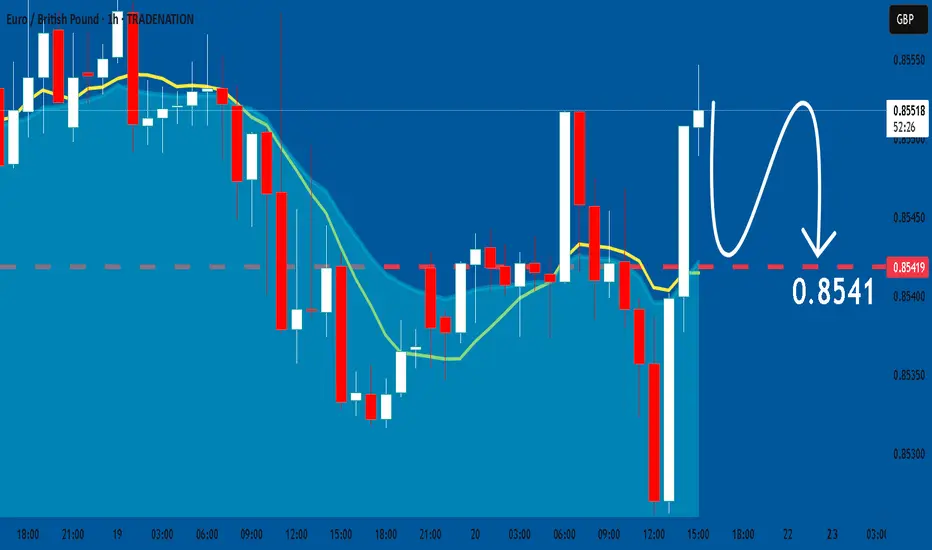
EUR_GBP WILL KEEP GROWI|LONG|
✅EUR_GBP broke the key horizontal level of 0.8540
Which is now a support then went down
To retest it and we are now seeing
A bullish reaction so I think that
The pair will go even higher up
LONG🚀
✅Like and subscribe to never miss a new idea!✅
Disclosure: I am part of Trade Nation's Influencer program and receive a monthly fee for using their TradingView charts in my analysis.

EURGBP: Bearish Forecast & Outlook
The charts are full of distraction, disturbance and are a graveyard of fear and greed which shall not cloud our judgement on the current state of affairs in the EURGBP pair price action which suggests a high likelihood of a coming move down.
Disclosure: I am part of Trade Nation's Influencer program and receive a monthly fee for using their TradingView charts in my analysis.
❤️ Please, support our work with like & comment! ❤️
Eurgbp Eurgbp price is on a uptrend and we are expecting more buys from the support so we wait for price to get to the zone be4 we buy

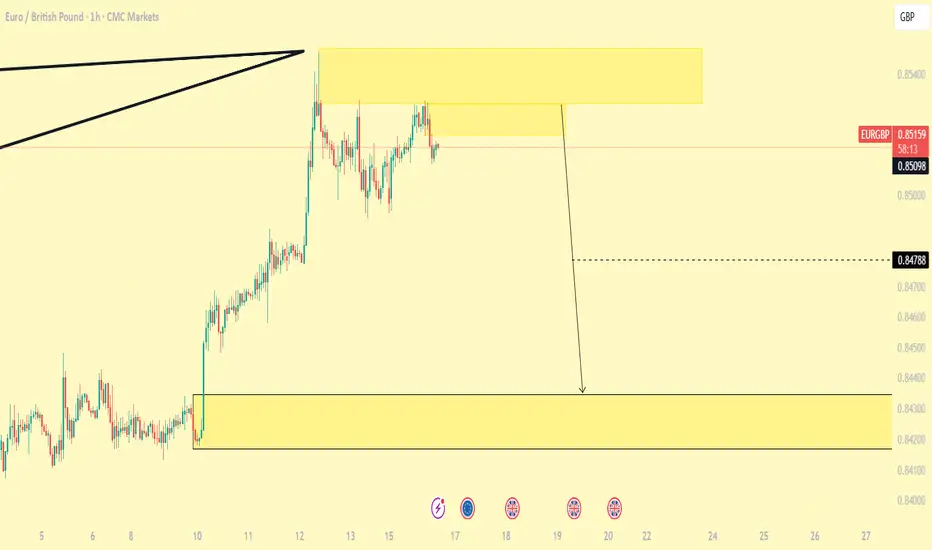
SHORT ON EUR/GPBWe have a rising channel (bearish reversal chart pattern) at a major level of resistance (confluence)
Price has given us a breakout of the channel to the downside and is currently respecting resistance.
I will be selling EUR/GBP to the next support level looking to catch over 120 pips.

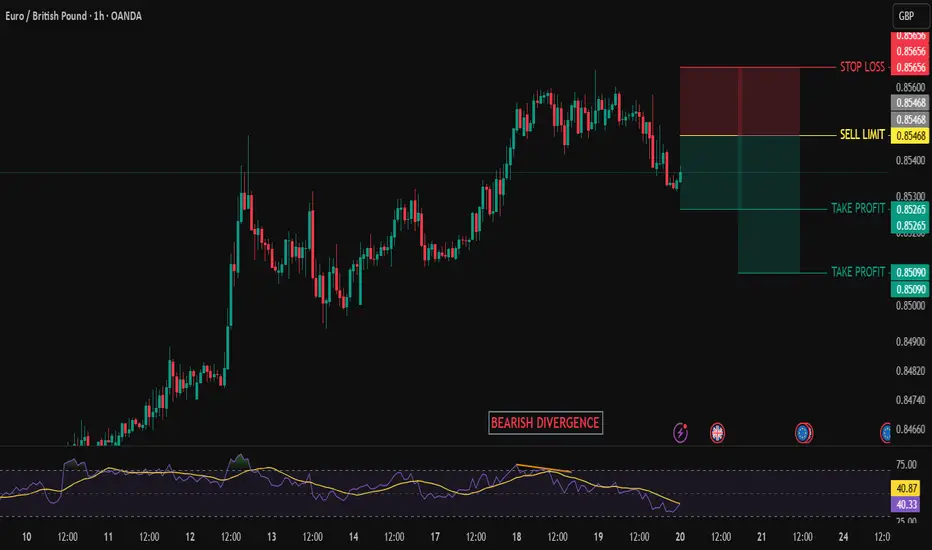
EURGBP BEARISH SETUPEURGBP has been a bullish trend.
At rsi bearish divergence formed.
And also price break previous HL, i would like to take entry with sell limit order at fib level 0.382.
Manage your trade accordingly.
EURGBP Bearish signal (Quick intra day trade) scalp trade only4H down trend 1H, M15, 5M
LL created, waiting for a LH to form at 50% Fib level
We will like to see price action formation e.g 50 ema rejecting price, bearish engulfing candle
or a long wick rejecting this resistance level and the 50% fib level
The more confirmations the better.


EUR/GBP BEARS ARE STRONG HERE|SHORT
Hello, Friends!
Bearish trend on EUR/GBP, defined by the red colour of the last week candle combined with the fact the pair is overbought based on the BB upper band proximity, makes me expect a bearish rebound from the resistance line above and a retest of the local target below at 0.846.
Disclosure: I am part of Trade Nation's Influencer program and receive a monthly fee for using their TradingView charts in my analysis.
✅LIKE AND COMMENT MY IDEAS✅

EURGBP uptrend pause supported at 0.8510Trend Overview:
EURGBP remains in a bullish trend, characterised by higher highs and higher lows. The recent intraday price action is forming a continuation consolidation pattern, suggesting a potential pause before a renewed move higher.
Key Technical Levels:
Support: 0.8510 (primary pivot), followed by 0.8490 and 0.8470
Resistance: 0.8570 (initial), then 0.8590 and 0.8620
Technical Outlook:
A pullback to the 0.8510 level, which aligns with the previous consolidation zone, could act as a platform for renewed buying interest. A confirmed bounce from this support may trigger a continuation toward the next resistance levels at 0.8570, 0.8590, and ultimately 0.8620.
Conversely, a daily close below 0.8510 would suggest weakening bullish momentum. This scenario would shift the bias to bearish in the short term, potentially targeting 0.8490 and 0.8470 as downside levels.
Conclusion:
WTI Crude Oil maintains a bullish structure while trading above the 0.8510 support. A bounce from this level would validate the consolidation as a continuation pattern, with upside potential toward the 08570 area. A breakdown below 0.8510, however, would invalidate this view and suggest deeper corrective risk.
This communication is for informational purposes only and should not be viewed as any form of recommendation as to a particular course of action or as investment advice. It is not intended as an offer or solicitation for the purchase or sale of any financial instrument or as an official confirmation of any transaction. Opinions, estimates and assumptions expressed herein are made as of the date of this communication and are subject to change without notice. This communication has been prepared based upon information, including market prices, data and other information, believed to be reliable; however, Trade Nation does not warrant its completeness or accuracy. All market prices and market data contained in or attached to this communication are indicative and subject to change without notice

The Day AheadKey Market Drivers:
1. Australia Jobs Data (May)
• Jobs unexpectedly fell → AUD weakened
• AUDUSD dipped toward support; bearish bias unless RBA signals hawkish stance
• Best plays: Short AUD vs NZD, USD
2. Swiss & Norwegian Rate Cuts
• SNB cut to 0.0%, Norges Bank cut to 4.25%
• Both were dovish surprises → CHF and NOK sold off
• Best plays: Long USDCHF, EURCHF, and EURNOK
3. Bank of England (BoE)
• Held rates at 4.25%, but 2 members voted to cut
• Slightly dovish tilt → GBP under mild pressure
4. ECB Speakers
• Lagarde gave no policy signals
• Watch Villeroy/Nagel for hawkish comments → may support EUR
5. Juneteenth Holiday in US
• US markets closed → low liquidity, possible volatility in FX during London/Asia sessions
Trade Focus Summary:
• Sell CHF & NOK on dovish central bank moves
• Fade AUD rallies after weak jobs data
• Watch GBP for downside on BoE dovish lean
• EUR in play if ECB officials remain hawkish
• Expect thin trading due to US holiday
This communication is for informational purposes only and should not be viewed as any form of recommendation as to a particular course of action or as investment advice. It is not intended as an offer or solicitation for the purchase or sale of any financial instrument or as an official confirmation of any transaction. Opinions, estimates and assumptions expressed herein are made as of the date of this communication and are subject to change without notice. This communication has been prepared based upon information, including market prices, data and other information, believed to be reliable; however, Trade Nation does not warrant its completeness or accuracy. All market prices and market data contained in or attached to this communication are indicative and subject to change without notice.


19.06.25 Morning ForecastPairs on Watch -
FX:EURGBP
FX:EURAUD
FX:AUDNZD
A short overview of the instruments I am looking at for today, multi-timeframe analysis down to what I will be looking at for an entry. Enjoy!

EURGBP SELL SIGNAL!Hello, all analysis are on the chart, this is a sell signal for me. Enjoy the trade!
EURGBP- Bullish Call story : Market is making series of HH and HL. However the market has formed minor divergence which made the market to take corrective move uptil 0.382 level of FIb. further market is overall in bull trend with the formation of Bullish continuation pattern.
anticipate: Bulls will take control of market and we anticipate that it will rise further after breaking HH or the neckline of bullish flag pattern.
Plan: we have taken entry on HL / instant entry and kept our SL below previous HL and we plan our TPs till the projection of Flag pattern with R:R of 1:1 and 1:2
Bulls Weight : 02
Flag Pattern
HH and HLs.
Beas Weight : 01
Divergence

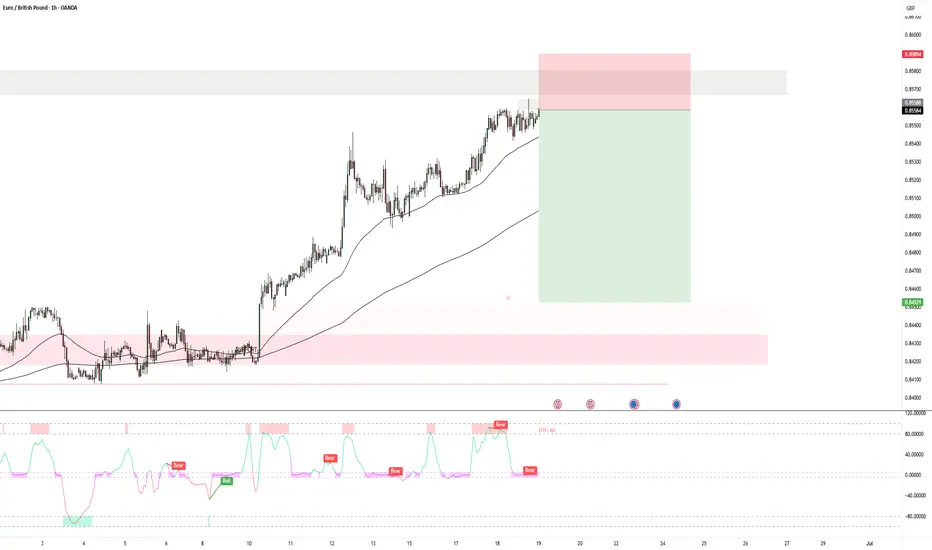
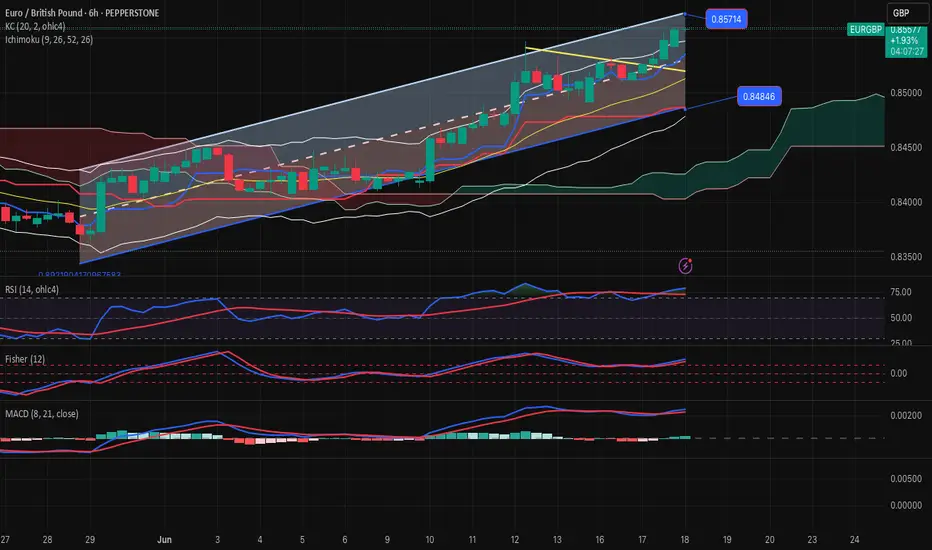
EURGBP-SELL Strategy 6 hourly chart Reg. ChannelThe pair is slightly overbought, and we are nearing the top of the channel. Indicators are not as yet negative, however, it feels we may have seen near the top for now, and it may be worthwhile to start scaling in on SELL side slowly.
Strategy SELL @ 0.8550-0.8575 and take profit near 0.8463 for now.
EURGBP: A Bullish Weekly OutlookEURGBP: A Bullish Weekly Outlook
This is an analysis I shared last months from a weekly perspective. The chart shows that the price increased by approximately 500 pips.
EURGBP tested an old weekly support zone that has consistently proven strong over time. Once again, the price reacted well, though it remains hesitant to extend its rise. However, bullish pressure is evident each time the price dips into the blue zone.
In May, this area was tested again, and EURGBP responded clearly, reinforcing the significance of this support. Historically, EURGBP has tested this zone in 2016, 2017, 2020, and 2022, each time showing notable reactions.
Following the start of an uptrend, EURGBP has previously gained between 400 to 900 pips, highlighting the potential strength of future movements.
You may find more details in the chart!
Thank you and Good Luck!
❤️PS: Please support with a like or comment if you find this analysis useful for your trading day❤️
Disclosure: I am part of Trade Nation's Influencer program and receive a monthly fee for using their TradingView charts in my analysis.
Previous analysis:

EURGBP upside target 0.8600On the daily chart, EURGBP stabilized after the bullish bat pattern. At the same time, the current market formed a head and shoulders bottom pattern. At present, we can pay attention to the support near 0.8450. If it falls back and does not break, it is expected to continue to rise, and the upward target is around 0.8600.

EURGBP INTRADAY trend reversal breakout?Trend Overview:
EURGBP remains in a bullish trend, characterised by higher highs and higher lows. The recent intraday price action is forming a continuation consolidation pattern, suggesting a potential pause before a renewed move higher.
Key Technical Levels:
Support: 0.8490 (primary pivot), followed by 0.8470 and 0.8450
Resistance: 0.8550 (initial), then 0.8570 and 0.8590
Technical Outlook:
A pullback to the 0.8490 level, which aligns with the previous consolidation zone, could act as a platform for renewed buying interest. A confirmed bounce from this support may trigger a continuation toward the next resistance levels at 0.8550, 0.8570, and ultimately 0.8590.
Conversely, a daily close below 0.8490 would suggest weakening bullish momentum. This scenario would shift the bias to bearish in the short term, potentially targeting 0.8470 and 0.8450 as downside levels.
Conclusion:
WTI Crude Oil maintains a bullish structure while trading above the 0.8490 support. A bounce from this level would validate the consolidation as a continuation pattern, with upside potential toward the 08550 area. A breakdown below 0.8490, however, would invalidate this view and suggest deeper corrective risk.
This communication is for informational purposes only and should not be viewed as any form of recommendation as to a particular course of action or as investment advice. It is not intended as an offer or solicitation for the purchase or sale of any financial instrument or as an official confirmation of any transaction. Opinions, estimates and assumptions expressed herein are made as of the date of this communication and are subject to change without notice. This communication has been prepared based upon information, including market prices, data and other information, believed to be reliable; however, Trade Nation does not warrant its completeness or accuracy. All market prices and market data contained in or attached to this communication are indicative and subject to change without notice.

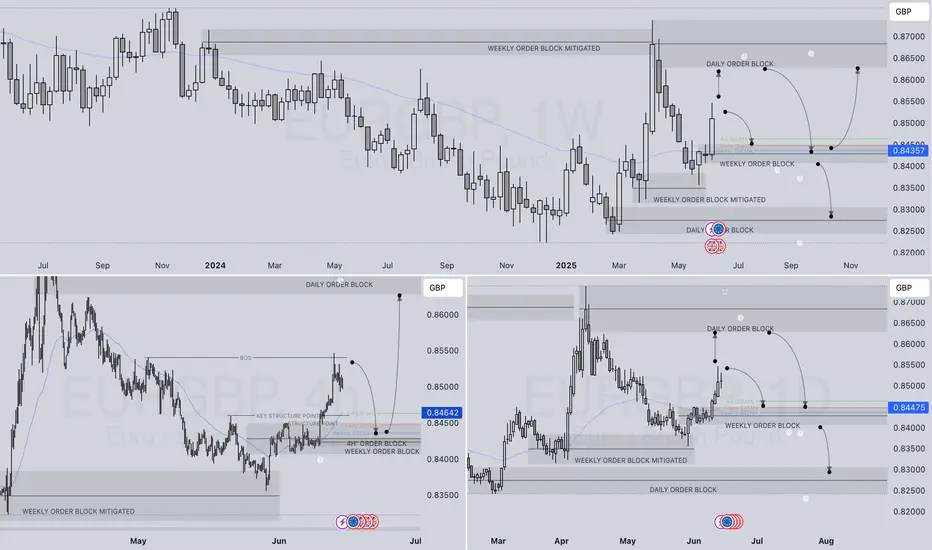
EURGBP LONG FORECAST Q2 W25 D16 Y25EURGBP LONG FORECAST Q2 W25 D16 Y25
Professional Risk Managers👋
Welcome back to another FRGNT chart update📈
Diving into some Forex setups using predominantly higher time frame order blocks alongside confirmation breaks of structure.
Let’s see what price action is telling us today! 👀
💡Here are some trade confluences📝
✅Weekly Order block rejection
✅15' Order block to be confirmed
✅4H Order block identification
✅HTF 50 EMA support
🔑 Remember, to participate in trading comes always with a degree of risk, therefore as professional risk managers it remains vital that we stick to our risk management plan as well as our trading strategies.
📈The rest, we leave to the balance of probabilities.
💡Fail to plan. Plan to fail.
🏆It has always been that simple.
❤️Good luck with your trading journey, I shall see you at the very top.
🎯Trade consistent, FRGNT X

POSSIBLE BUY OPPORTUNITY ON EURGBPEURGBP has begun the continuation to the upside that we have been waiting for weeks now. We have a reasonable area of demand just below current price where we are looking to take a trade.

EURGBP WEEKLY HTF FORECAST Q2 W25 Y25EURGBP WEEKLY HTF FORECAST Q2 W25 Y25
Professional Risk Managers👋
Welcome back to another FRGNT chart update📈
Diving into some Forex setups using predominantly higher time frame order blocks alongside confirmation breaks of structure.
🔑 Remember, to participate in trading comes always with a degree of risk, therefore as professional risk managers it remains vital that we stick to our risk management plan as well as our trading strategies.
📈The rest, we leave to the balance of probabilities.
💡Fail to plan. Plan to fail.
🏆It has always been that simple.
❤️Good luck with your trading journey, I shall see you at the very top.
🎯Trade consistent, FRGNT X