EURGBPLooking at your EUR/GBP analysis, the pair appears to be approaching a critical reversal zone that could mark the end of the current downtrend.
The price action shows a clear Elliott Wave structure, with what appears to be a completed 5-wave decline from the highs marked at point (a). Currently, the pair is testing the significant support area highlighted in the pink box around the 0.786 level (0.83479), which coincides with the completion of wave 5.
This convergence of technical factors suggests we're entering a high-probability reversal area. The completion of the impulsive wave structure, combined with the pair reaching this key support zone, indicates that selling pressure may be exhausting.
From this level, we should anticipate a bullish reversal to develop soon. The initial upside targets would likely include the previous wave 4 area and the descending trendline resistance. A successful break above these levels would confirm the trend reversal and open the path for a more substantial recovery move.
Traders should watch for early signs of buying interest, such as bullish candlestick patterns or positive divergences on momentum indicators, to confirm the anticipated reversal. The risk-reward setup appears favorable for long positions near current levels, with stops below the support box.
EURGBP trade ideas

Bullish bounce?EUR/GBP is falling towards the pivot and could bounce to the 1st resistance, which has been identified as an overlap resistance.
Pivot: 0.8377
1st Support: 0.8326
1st Resistance: 0.8461
Risk Warning:
Trading Forex and CFDs carries a high level of risk to your capital and you should only trade with money you can afford to lose. Trading Forex and CFDs may not be suitable for all investors, so please ensure that you fully understand the risks involved and seek independent advice if necessary.
Disclaimer:
The above opinions given constitute general market commentary, and do not constitute the opinion or advice of IC Markets or any form of personal or investment advice.
Any opinions, news, research, analyses, prices, other information, or links to third-party sites contained on this website are provided on an "as-is" basis, are intended only to be informative, is not an advice nor a recommendation, nor research, or a record of our trading prices, or an offer of, or solicitation for a transaction in any financial instrument and thus should not be treated as such. The information provided does not involve any specific investment objectives, financial situation and needs of any specific person who may receive it. Please be aware, that past performance is not a reliable indicator of future performance and/or results. Past Performance or Forward-looking scenarios based upon the reasonable beliefs of the third-party provider are not a guarantee of future performance. Actual results may differ materially from those anticipated in forward-looking or past performance statements. IC Markets makes no representation or warranty and assumes no liability as to the accuracy or completeness of the information provided, nor any loss arising from any investment based on a recommendation, forecast or any information supplied by any third-party.

EUR_GBP RISKY LONG|
✅EUR_GBP is going down to retest
A horizontal support of 0.8380
Which makes me locally bullish biased
And I think that we will see a rebound
And a move up from the level
Towards the target above at 0.8414
LONG🚀
✅Like and subscribe to never miss a new idea!✅
Disclosure: I am part of Trade Nation's Influencer program and receive a monthly fee for using their TradingView charts in my analysis.

Possibility of uptrend A trend reversal is expected at the current support level. Then, a break of the green resistance level will confirm the uptrend. Otherwise, a break of the support level will likely lead to a continuation of the downtrend.

Could the price bounce from here?EUR/GBP is falling towards the support level that lines up with the 127.2% Fibonacci extension and the 61.8% Fibonacci projection and could bounce from this level too ur take profit.
Entry: 0.8373
Why we like it:
There is an overlap support level that lines up with the 127.2% Fibonacci extension and the 61.8% Fibonacci projection.
Stop loss: 0.8322
Why we like it:
There is a pullback support level that is slightly above the 100% Fibonacci projection.
Take profit: 0.8444
Why we lik eit:
There is a pullback resistance level.
Enjoying your TradingView experience? Review us!
Please be advised that the information presented on TradingView is provided to Vantage (‘Vantage Global Limited’, ‘we’) by a third-party provider (‘Everest Fortune Group’). Please be reminded that you are solely responsible for the trading decisions on your account. There is a very high degree of risk involved in trading. Any information and/or content is intended entirely for research, educational and informational purposes only and does not constitute investment or consultation advice or investment strategy. The information is not tailored to the investment needs of any specific person and therefore does not involve a consideration of any of the investment objectives, financial situation or needs of any viewer that may receive it. Kindly also note that past performance is not a reliable indicator of future results. Actual results may differ materially from those anticipated in forward-looking or past performance statements. We assume no liability as to the accuracy or completeness of any of the information and/or content provided herein and the Company cannot be held responsible for any omission, mistake nor for any loss or damage including without limitation to any loss of profit which may arise from reliance on any information supplied by Everest Fortune Group.

Why EUR vs GBP Could Be Your Best Trade This Week!When it comes to forex swing trading or even forex intraday trading, the temptation to zoom into lower timeframes—like the 15-minute or 1-hour charts—is strong. Most forex traders focus on short-term momentum, often diving into scalping strategies that chase quick pips. However, the real edge lies where most don’t look: the higher timeframes, particularly the weekly chart. The EUR/GBP forex pair is a perfect example of these higher timeframes' power, especially when paired with smart money concepts like demand and supply imbalances.
EUR/GBP: A Hidden Gem for Forex Swing Traders
The EUR/GBP Forex cross pair is often overlooked compared to major USD-based pairs. However, for seasoned swing traders and institutional players, EUR/GBP offers deep liquidity, cleaner technical analysis and price action structures, and strong reaction zones that are respected time and time again.
At the end of May 2025, a significant weekly demand imbalance at 0.8384 finally took control of price action—something smart money traders had been anticipating for months. This wasn't a surprise for those watching the higher timeframes. Similar to how the previous weekly imbalance at 0.8299 took control in February 2025, these zones have proven critical in guiding the medium- to long-term direction of EUR/GBP.

EURGBP Expected Growth! BUY!
My dear friends,
Please, find my technical outlook for EURGBP below:
The instrument tests an important psychological level 0.8393
Bias - Bullish
Technical Indicators: Supper Trend gives a precise Bullish signal, while Pivot Point HL predicts price changes and potential reversals in the market.
Target - 0.8412
About Used Indicators:
Super-trend indicator is more useful in trending markets where there are clear uptrends and downtrends in price.
Disclosure: I am part of Trade Nation's Influencer program and receive a monthly fee for using their TradingView charts in my analysis.
———————————
WISH YOU ALL LUCK

EUR/GBP Bullish Breakout Forming – Falling Wedge & Retest SetupEUR/GBP has been in a prolonged downtrend over the past several weeks, characterized by lower highs and lower lows. However, the recent price action shows signs of exhaustion in selling pressure, as the candles begin to compress into a Falling Wedge pattern — a classic bullish reversal formation.
The wedge is defined by two descending, converging trendlines. As price moves closer to the apex of this wedge, volatility contracts and volume typically dries up (not shown here, but conceptually expected). This signals that market participants are preparing for a directional breakout, most likely to the upside in this context.
🔍 Key Technical Elements:
🔸 1. Falling Wedge Pattern:
The Falling Wedge is a bullish setup that forms during a downtrend and signals a potential reversal when confirmed. Price here has followed a steady decline, but the slowing momentum and structure of the wedge suggest the sellers are losing control.
The wedge acts as a compression zone, where bearish moves are becoming less impactful.
Price touches both upper and lower wedge boundaries multiple times, increasing pattern validity.
A breakout has already occurred, and the pair is now undergoing a textbook retest of the broken wedge resistance (now acting as support).
🔸 2. Retest at Key Support Zone (SR Interchange):
The retest is happening precisely at a former support/resistance flip zone, labeled SR – Interchange on the chart. This is a historically significant area where price has reacted multiple times, adding confluence to the setup.
If this level holds during the retest, it may invite strong buying interest, fueling the bullish breakout move.
🔸 3. Resistance Zones & Targets:
Inner Resistance (~0.8460): First hurdle for bulls; breaching this will signal strong momentum.
Minor Resistance (~0.85618): This is the primary target of the setup, based on previous structure and wedge height projection.
Major Resistance (~0.8740): A longer-term bullish objective if momentum sustains beyond the first two targets.
These zones serve as logical areas for profit-taking and reassessment.
📐 Measured Move & Target Projection:
The projected breakout target of 0.85618 is derived using a combination of:
The vertical height of the wedge at its thickest point.
Previous market structure resistance zones.
Fibonacci and price symmetry (if analyzed further).
This target also aligns with a previous supply zone, making it a strong magnet for price if bullish momentum kicks in.
💡 Trading Plan (Not Financial Advice):
This setup provides a good risk-to-reward opportunity if executed with patience and proper confirmation:
Entry Zone: After bullish confirmation at the retest (e.g., bullish engulfing candle, pin bar, or break of minor lower high).
Stop Loss: Below the SR Interchange zone or recent swing low (~0.8350–0.8360).
Target 1: Inner Resistance (~0.8460)
Target 2: Minor Resistance (~0.85618)
Target 3 (extended): Major Resistance (~0.8740)
🔄 Market Psychology:
This chart setup reflects a shift in momentum and sentiment:
Sellers have driven the price down consistently but have failed to create new significant lows with force.
Buyers are stepping in at key demand zones, creating higher lows within the wedge.
The breakout suggests smart money accumulation, and the current retest offers one of the last low-risk entries before a broader move.
🔔 Confirmation to Watch:
Bullish reversal candlestick patterns at the retest zone.
Break above local lower highs near 0.8440–0.8460.
Momentum indicators (if used) showing divergence or crossover confirmation.
📉 Bias:
Short-Term Bullish
Valid if support at 0.8390–0.8400 holds and price confirms breakout continuation.
🧠 Minds Post (Expanded Explanation)
Title: EUR/GBP Bullish Reversal Developing – Falling Wedge Breakout Retest
EUR/GBP has broken out of a textbook falling wedge on the 4H chart, which often signals the end of a downtrend and beginning of a new bullish phase. The price is currently pulling back, testing the breakout zone — a crucial step in confirming the validity of the breakout.
If this retest holds, we may see a sharp move toward the 0.8460 and 0.8560 levels — both key resistances based on past price action.
This pattern reflects a deeper market psychology shift — from consistent bearish dominance to a potential bullish takeover. Smart money may already be positioning here.
I’m watching for confirmation at the support zone around 0.8390. If price holds and breaks above local highs, a continuation toward the upper resistance is likely.
Let the market come to you. Don’t chase. Wait for structure, then trade with confidence.


EUR/GBP BEARS ARE GAINING STRENGTH|SHORT
Hello, Friends!
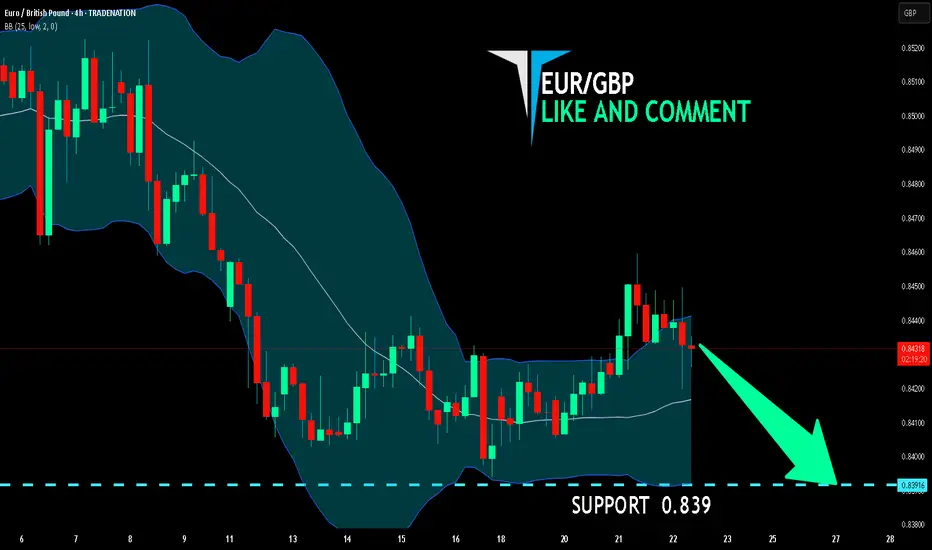
EUR/GBP pair is trading in a local downtrend which know by looking at the previous 1W candle which is red. On the 4H timeframe the pair is going up. The pair is overbought because the price is close to the upper band of the BB indicator. So we are looking to sell the pair with the upper BB line acting as resistance. The next target is 0.839 area.
Disclosure: I am part of Trade Nation's Influencer program and receive a monthly fee for using their TradingView charts in my analysis.
✅LIKE AND COMMENT MY IDEAS✅
TECHNICAL HOT PICK - EURGBP SHORT FORECAST Q2 W22 D26 Y25🔥👀TECHNICAL HOT PICK
EURGBP SHORT FORECAST Q2 W22 D26 Y25
Professional Risk Managers👋
Welcome back to another FRGNT chart update📈
Diving into some Forex setups using predominantly higher time frame order blocks alongside confirmation breaks of structure.
Let’s see what price action is telling us today!
💡Here are some trade confluences📝
✅Weekly order block
✅15' order block
✅Intraday bearish breaks of structure
✅Tokyo ranges to be filled
🔑 Remember, to participate in trading comes always with a degree of risk, therefore as professional risk managers it remains vital that we stick to our risk management plan as well as our trading strategies.
📈The rest, we leave to the balance of probabilities.
💡Fail to plan. Plan to fail.
🏆It has always been that simple.
❤️Good luck with your trading journey, I shall see you at the very top.
🎯Trade consistent, FRGNT X

EURGBP and the Lower LimitIn this trade, I will be entering a short position.
Analyzing the pair on minute timeframes, the pair broke through the area near the 0.83955 price level (a possible reversal zone).
After breaking through that area, there was a downward move, and after reaching 0.83802, it reversed back up to 0.84068, followed by another reversal (which may indicate the presence of a reversal and a pullback).
Considering all of the above, and also taking into account the technical analyses provided by Investing.com, I believe that a sell position represents a good opportunity in this pair.
The short position tool displayed on the chart serves only as a reference to support the entry into this trade.
Several moving averages and the Parabolic SAR were also used in this analysis, and they should be given close attention.

26.05.2025 - 30.05.2025 - EURGBP LONG POSITIONEURGBP - 26.05.2025 - 30.05.2025 Looking for LONG position on EURGBP

EURGBP FORCAST FOR NEXT WEEKSell Opportunity anticipation
Entry: 0.83994
Sl: 0.84077
Tp: 0.83200
Support breaken. Further sell anticipated.
Comments your opinion
For Account management. Connect on X @shajudeakinoba1

EURGBP - SELL SHORT - CHANNEL Bearish Indicators:
1- LH and LLs
2- Market moving in a strong Bearish Channel
3- Market has broken Support level with a bearish
engulfing candle and retracing back, forming LH

EUR/GBP "The Chunnel" Forex Bank Heist Plan (Scalping/Day Trade)🌟Hi! Hola! Ola! Bonjour! Hallo! Marhaba!🌟
Dear Money Makers & Robbers, 🤑💰✈️
Based on 🔥Thief Trading style technical and fundamental analysis🔥, here is our master plan to heist the EUR/GBP "The Chunnel" Forex Market. Please adhere to the strategy I've outlined in the chart, which emphasizes short entry. Our aim is the high-risk YELLOW MA Zone. It's a Risky level, oversold market, consolidation, trend reversal, trap at the level where traders and bullish robbers are stronger. 🏆💸"Take profit and treat yourself, traders. You deserve it!💪🏆🎉
Entry 📈 : "The vault is wide open! Swipe the Bearish loot at any price - the heist is on!
however I advise to Place sell limit orders within a 15 or 30 minute timeframe most nearest or swing, low or high level for Pullback Entries.
Stop Loss 🛑:
📌Thief SL placed at the nearest/swing High or Low level Using the 4H timeframe (0.85400) Day/Swing trade basis.
📌SL is based on your risk of the trade, lot size and how many multiple orders you have to take.
Target 🎯: 0.84000
💰💵💸EUR/GBP "The Chunnel" Forex Market Heist Plan (Scalping/Day Trade) is currently experiencing a Bearish trend.., driven by several key factors.👇👇👇
📰🗞️Get & Read the Fundamental, Macro, COT Report, Quantitative Analysis, Sentimental Outlook, Intermarket Analysis, Future trend targets and Overall outlook score..., go ahead to check 👉👉👉🔗🔗🌎🌏🗺
⚠️Trading Alert : News Releases and Position Management 📰 🗞️ 🚫🚏
As a reminder, news releases can have a significant impact on market prices and volatility. To minimize potential losses and protect your running positions,
we recommend the following:
Avoid taking new trades during news releases
Use trailing stop-loss orders to protect your running positions and lock in profits
💖Supporting our robbery plan 💥Hit the Boost Button💥 will enable us to effortlessly make and steal money 💰💵. Boost the strength of our robbery team. Every day in this market make money with ease by using the Thief Trading Style.🏆💪🤝❤️🎉🚀
I'll see you soon with another heist plan, so stay tuned 🤑🐱👤🤗🤩

EUR/GBP – Bearish Triangle Breakdown in Play (Long-Term Setup)This EUR/GBP weekly chart is flashing a long-term bearish triangle pattern that has finally broken down, signaling potential for a major move to the downside. This setup is packed with high-confluence signals that traders should not ignore.
🔍 Pattern Breakdown:
📐 Bearish Triangle Pattern
The pair has been forming lower highs while maintaining a relatively flat support base, forming a descending triangle, a classically bearish continuation pattern.
The pressure has been building for over 6 years, with buyers failing to make new highs while sellers stepped in aggressively at lower levels.
The triangle support has now been broken, and price is entering a retest phase, which is critical for confirming the breakdown.
🟧 Black Mind Curve Resistance
A unique visual tool here is the Black Mind Curve — a curved trendline that mirrors the psychology of long-term resistance.
This curve has consistently capped price action since the 2009 peak, reinforcing the dominance of sellers in this zone.
Every time price reached this curve, it reversed — confirming it as a dynamic resistance.
🧱 Major Horizontal Resistance Zone
The shaded blue zone around 0.92–0.93 represents a long-term resistance area, which has repeatedly rejected price for over a decade.
This zone also aligns with the Black Mind Curve, adding to the confluence.
The most recent swing high failed to break this area, and the pair rolled over again.
🔄 Retesting in Progress
After the recent breakdown of triangle support, price is currently retesting the underside of the broken support line (now acting as resistance).
This is a textbook setup: break → retest → continuation.
If this retest fails (which is likely based on history), the bearish move should resume.
🎯 Bearish Target Projection
The projected move from the triangle breakdown points to the 0.64330 area, which aligns with a major support level from early 2007 and 2008.
This level is a high-probability magnet if the pattern plays out in full — giving a long-term swing trade or position-trading opportunity.
🧠 Why This Matters (Pro Insights)
This chart is powerful because:
It’s on the weekly timeframe – high conviction and larger moves.
It shows a long-term squeeze finally breaking.
Resistance is reinforced by multiple layers (curve + horizontal zone).
Retest confirms possible continuation sell setup.
This isn’t a short-term scalp — it’s a position trade idea that could develop over months or even a couple years, with a massive risk-reward potential.
⚠️ Trade Plan Summary
Bias: Bearish
Pattern: Descending Triangle (broken)
Current Action: Retesting broken support
Entry Zone: On bearish rejection near 0.8400–0.8450
Stop Loss: Above resistance zone (around 0.9285)
Target: 0.64330
Risk/Reward: Potentially >4:1 on a swing basis

EURGBP in bearish trend EURGBP in bearish trend abut to face a a trend reversal, RSI diversion can be seen

Sell to major buysMajor trend is bullish and on 4hr bearish drop is almost comming to an end only buy on confirmation

check the trendThe current support level is expected to change and the uptrend will begin. A break of the green resistance level will confirm the uptrend.

EUR/GBP🔹Symbol: EUR/GBP
🔹Price: 0.84374
🔹Stop loss: 0.84693
🔹Take profit 1: 0.84055
🔹Take profit 2: 0.83742
🔹Take profit 3: 83262
📊Check your chart before entering.
♦️Check before use to make sure there is no important news.

GBPEUR Bullish - £1.00/1.19 and aboveSimple chart based on candle recovery. Pound looks bullish if no negative economic news emerge or Trump does something unexpected "hehe" I am confident that the pair will attack 1.20 and recover/test the 1.21 range and might go sideways from there fluctuating between 1.18 to 1.21 for the mid term.

EURGBP new fall expecting
OANDA:EURGBP whats next, we are have break of DESCENDING TRIANGL, then its be created DESCENDING CHANNEL, which also is be breaked, now we have breaked and trend line.
Price currently is in zone. Expectations are to see break of zone and higher bearish fall.
SUP zone: 0.84600
RES zone: 0.83500, 0.83200
