EURGBP SHORT FORECAST Q2 W20 D16 Y25EURGBP SHORT FORECAST Q2 W20 D16 Y25
Professional Risk Managers👋
Welcome back to another FRGNT chart update📈
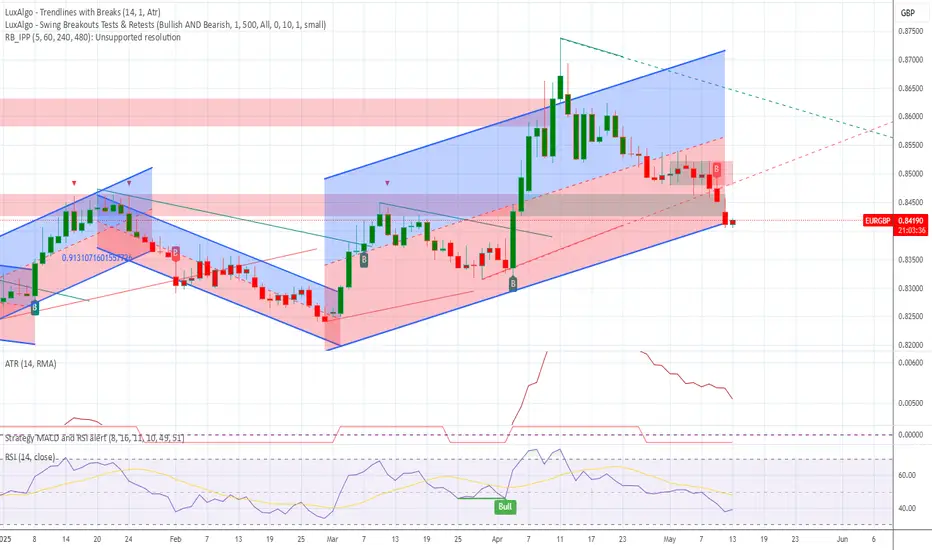
Diving into some Forex setups using predominantly higher time frame order blocks alongside confirmation breaks of structure.
Let’s see what price action is telling us today!
💡Here are some trade confluences📝
✅Weekly order block
✅15' order block
✅Intraday bearish breaks of structure
✅Tokyo ranges to be filled
🔑 Remember, to participate in trading comes always with a degree of risk, therefore as professional risk managers it remains vital that we stick to our risk management plan as well as our trading strategies.
📈The rest, we leave to the balance of probabilities.
💡Fail to plan. Plan to fail.
🏆It has always been that simple.
❤️Good luck with your trading journey, I shall see you at the very top.
🎯Trade consistent, FRGNT X
EURGBP trade ideas

EUR/GBP Caper: Bearish Breakout Blueprint!🌍 Greetings, global money heisters! 🌟 Welcome to the EUR/GBP "Chunnel" Forex Market caper! 🤑💸
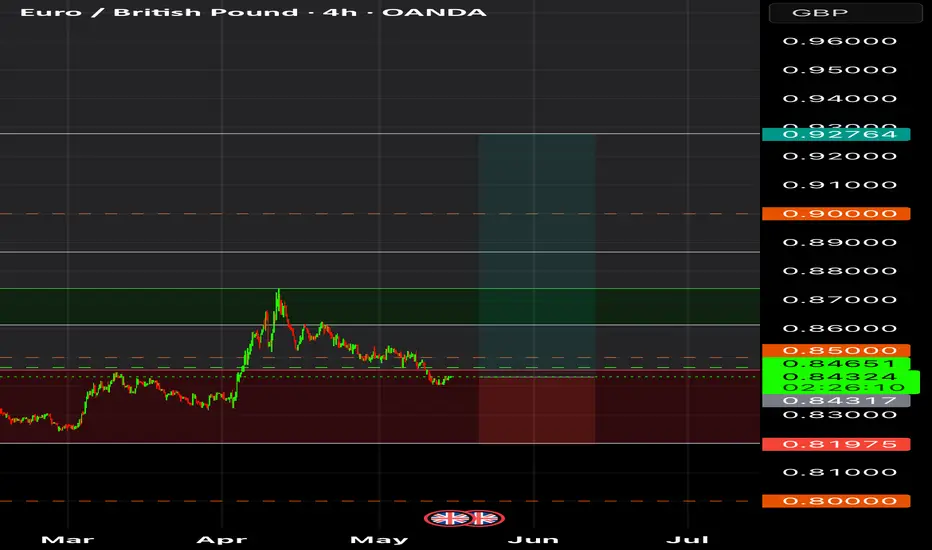
Dear traders and fortune chasers, get ready to execute our cunning plan based on the 🔥 Thief Trading Style 🔥, blending sharp technicals with savvy fundamentals. Our mission? A slick short entry targeting the high-risk Support Zone. The market’s oversold, consolidation’s brewing, and a trend reversal’s lurking—perfect for our ambush! 🏆🎯 Here’s the blueprint to steal those pips! 🚀
Entry 📈: The heist kicks off at the Major Support breakout. Lock in your sell at 0.84000 for bearish gains! 💰 For precision, set sell stop orders above the Moving Average or sell limit orders post-breakout within a 15/30-minute window near the swing low/high for pullback entries. 📌 Pro tip: Set a chart alert 🚨 to catch the breakout moment!
Stop Loss 🛑: Stay sharp, crew! For sell stop orders, hold off on placing your stop loss until the breakout confirms. 📍 Place it at the nearest swing high/low on the 4H timeframe (0.84400) for swing/day trades. Adjust based on your risk, lot size, and multiple orders. Play smart—your capital, your rules! ⚠️🔥
Target 🎯: Aim for 0.83500 or slip out early if the market whispers an escape. 🏃♂️💨
💵 Why’s the Chunnel ripe for the taking? The EUR/GBP’s in a bearish groove, driven by key market signals. Curious? Dive into the fundamentals, COT reports, sentiment, and intermarket analysis for the full scoop! 🌎🔗 Check linkk macro trends and future targets & overall score. 📊
⚠️ Trading Alert: News can shake the market like a getaway car! 📰🚗 Avoid new trades during high-impact releases and use trailing stops to lock in profits and shield your positions. Safety first, heisters! 🚫🔐
💖 Boost our heist! Hit that Boost Button 🚀 to fuel our Thief Trading crew. With daily market raids, we’re stacking pips and living the trader’s dream! 🤑🤝 Stay tuned for the next caper—more profits await! 🐱👤🎉
Happy heisting, and let’s make those charts bleed green! 💪🌟


EUR/GBP LONG Investment Opportunities: Technical Analysis
The currency market offers new investment opportunities, and among the most interesting pairs of the moment we find EUR/GBP, with a favorable configuration for a long trade.
Entry Point and Trading Objectives
Entry: 0.8526
Take Profit (TP): +1.34%
Stop Loss (SL): -0.44%
This trade is based on in-depth technical analysis, considering key support and resistance levels that reinforce the hypothesis of a bullish movement.
Technical Analysis and Market Trends
After a consolidation phase around the 0.8526 threshold, the currency cross shows signs of bullish strength, with technical indicators confirming a potential breakout.
Primary Trend: Bullish with dynamic support.
RSI: In the neutral zone, indicating room for further growth.
Moving Averages: The 50-period crossed the 200-period, a sign of positive momentum.
Optimism on the single currency is also supported by fundamental factors, including monetary policies of the European Central Bank (ECB) and economic dynamics of the United Kingdom.
Risk Management and Final Considerations
To mitigate market volatility, the trade is accompanied by a Stop Loss at -0.44%, to protect the capital from any unexpected reversals.
Investors interested in this opportunity should carefully monitor macroeconomic events, such as inflation data and interest rate decisions, which could influence the direction of the EUR/GBP exchange rate.

EURGBP | Sideways | Non TrendingEURGBP is making sideways movements and is testing its first support level time and again.It is npt only testin its first support level but also honoring it by bouncing back upwards.

EURGBP Bullish Optimism Over SupportHi there,
"EUR/GBP appears bullish on the M30 timeframe, targeting 0.84583 with two price target zones. If the price falls and closes below 0.83912, the market bias will be invalidated.
It will need monitoring.
Happy Trading,
K.
Not trading advice

Buy EURGBPCurrently it seems as though price has broken out of a structure and retested. I am anticipating a bullish rally on EURGBP price towards the resistance at 0,848

Symmetrical TriangleLong position opportunity
Symmetrical Triangle Pattern ( 4HR Timeframe )
Look for price to continue upwards if the monthly candle finishing as a rejection
EURGBP SHORT FORECAST Q2 W20 D15 Y25EURGBP SHORT FORECAST Q2 W20 D15 Y25
Professional Risk Managers👋
Welcome back to another FRGNT chart update📈
Diving into some Forex setups using predominantly higher time frame order blocks alongside confirmation breaks of structure.
Let’s see what price action is telling us today!
💡Here are some trade confluences📝
✅Weekly order block
✅15' order block
✅Intraday bearish breaks of structure
✅Tokyo ranges to be filled
🔑 Remember, to participate in trading comes always with a degree of risk, therefore as professional risk managers it remains vital that we stick to our risk management plan as well as our trading strategies.
📈The rest, we leave to the balance of probabilities.
💡Fail to plan. Plan to fail.
🏆It has always been that simple.
❤️Good luck with your trading journey, I shall see you at the very top.
🎯Trade consistent, FRGNT X

EURGBP Analysis: Two Daily POIsHello traders!
EURGBP is offering two trading scenarios on the daily timeframe.
The first scenario suggests the pair may react bullishly from the next zone, setting up a bounce opportunity that could drive price higher toward the 0.84400 area.
The second scenario anticipates a bounce toward the 0.83800 area, where a mean reversion setup may come into play (if buyers step in and price action confirms bullish intent near that support).
Discretionary Trading: Where Experience Becomes the Edge
Discretionary trading is all about making decisions based on what you see, what you feel, and what you've learned through experience. Unlike systematic strategies that rely on fixed rules or algorithms, discretionary traders use their judgment to read the market in real time. It's a skill that can't be rushed, because it's built on screen time, pattern recognition, and the ability to stay calm under pressure.
There's no shortcut here. You need to see enough market conditions, wins, and losses to build that intuition—the kind that tells you when to pull the trigger or sit on your hands. Charts might look the same, but context changes everything, and that's something only experience can teach you.
At the end of the day, discretionary trading is an art, refined over time, sharpened through mistakes, and driven by instinct. It's not for everyone, but for those who've put in the work, it can be a powerful way to trade.

EURGBP Perfect long entry hereSuccessfully breakout this resistant line, buy at support with a short -term target of at least +10%

EUR/GBP Swing IdeaEUR/GBP Has Broken Highs In The Daily Timeframe. The Fib Extension Pulled On The Daily Timeframe Indicates A PullBack To Daily Fair Value Gap, If We Go Down To The 30M We Can See We Have Supassed 71% And Also 75% Zones But We Are Now Heading Towards The 30M Fvg Which Caused The New Daily High.
Earlier Today We Can See A Change Of Character Which I Believe To Be Fake And Also A Liquidity Grab Simply Because We Didn't Make A New High After The Change Of Character.
The RSI Clearly Shows Buyers Stepping Into The Market.
Therefore I Am Waiting For A Drop Into The 30M Fair Value Gap And Then A Chage Of Character, New High, Liquidity Sweep And The Enter.
Trade Safefully.
HK

EURGBP - LONG | BUYCALL | Sentiments -Strong Bullish Divergence based on strong sentiments at bullish side and strong bullish divergence, the pair seems to be bullish shortly. Market once breaks the last LH we can enter into the market with defined TPs and SL.
HAPPAY TRADIND GUYZ !

EUR/GBP For Bullish as pull-backyou can go long now
or
wait for pull-back near by entry point and then go long
general trend is down trend
current phase is pull-back
have fun :)

EURGBP chart showing non trending chartEURGBP showing non trending chart and I am booking my trade using support and resistance technique

EURGBP BUY TRADE PLAN🔹🔥 Pair + Date: EUR/GBP – May 14, 2025
📋 Plan Overview Table
Type Direction Confidence R:R Status
Swing Long 80% 1:3.2 ✅ Active
📈 Market Bias & Type
Bias: Bullish Short-Term Reversal
Type: Swing Reversal from H4 Demand & D1 Reaction Zone
🔰 Confidence Level: 80%
Breakdown:
HTF Structure Support Zone: ✅
Bullish Divergence (Micro): ✅
H1 Double Bottom Structure: ✅
Volume Spike at Sweep: ⏳ Pending
H1 Candle Reversal: ✅ (Engulfing Setup Forming)
📍 Entry Zones
Primary Buy Zone: 0.83900 – 0.84020 (H4 Demand + D1 Wick Base)
Secondary Zone (Low Confidence): 0.83750 (Only if spike sweep happens)
❗ SL with Reasoning
Stop Loss: 0.83590
Below structural low + demand invalidation
🎯 TP Targets
TP1: 0.84550 (Last LH Supply Area)
TP2: 0.84800 (Imbalance Close)
TP3: 0.85180 (Daily Supply + Structure)
🧠 Management Strategy
Risk: Max 0.5%
Scale-in on H1 Bullish BOS
Breakeven after 0.84300 reclaim
⚠️ Confirmation Checklist
Signal Required Present
H1 Engulfing Candle ✅ ✅
Sweep of Previous Low ✅ ✅
Volume Spike ✅ ⏳
Frankfurt/LDN Session Tap ✅ ✅
⏳ Validity
Timeframe: H4 Structure
Validity: 48–72h
❌ Invalidation Conditions
Clean break + close below 0.83590
No confirmation on retest or sweep
🌐 Fundamental & Sentiment Snapshot
UK GDP & BoE neutral bias, EUR supported by recent stabilization
EURGBP near historical support with decreasing GBP strength
COT: Slight EUR long increase, GBP neutral
📋 Final Trade Summary
This is a high-probability swing reversal trade backed by HTF demand zone structure, HTF compression leg exhaustion, and reactive wick formation. Confirmation in progress on H1. Will scale in on BOS & hold toward daily imbalance.

Market Analysis: EUR/GBP Loses GroundMarket Analysis: EUR/GBP Loses Ground
EUR/GBP declined steadily below the 0.8460 and 0.8440 support levels.
Important Takeaways for EUR/GBP Analysis Today
- EUR/GBP is trading in a bearish zone below the 0.8460 pivot level.
- There was a break above a connecting bearish trend line with resistance near 0.8410 on the hourly chart at FXOpen.
EUR/GBP Technical Analysis
On the hourly chart of EUR/GBP at FXOpen, the pair started a fresh decline from well above 0.8500. The Euro traded below the 0.8430 level and tested 0.8400. It is now consolidating losses and trading below the 50-hour simple moving average. However, there was a break above a connecting bearish trend line with resistance near 0.8410.
The pair is now facing resistance near the 23.6% Fib retracement level of the downward move from the 0.8522 swing high to the 0.8399 low at 0.8430.
The next major resistance could be 0.8460. It coincides with the 50% Fib retracement level of the downward move from the 0.8522 swing high to the 0.8399 low. The main resistance is near the 0.8495 zone. A close above the 0.8495 level might accelerate gains. In the stated case, the bulls may perhaps aim for a test of 0.8520. Any more gains might send the pair toward the 0.8550 level.
Immediate support sits near 0.8400. The next major support is near 0.8365. A downside break below the 0.8365 support might call for more downsides. In the stated case, the pair could drop toward the 0.8300 support level.
This article represents the opinion of the Companies operating under the FXOpen brand only. It is not to be construed as an offer, solicitation, or recommendation with respect to products and services provided by the Companies operating under the FXOpen brand, nor is it to be considered financial advice.

EUR/GBP BEST PLACE TO BUY FROM|LONG
Hello, Friends!
We are now examining the EUR/GBP pair and we can see that the pair is going down locally while also being in a downtrend on the 1W TF. But there is also a powerful signal from the BB lower band being nearby indicating that the pair is oversold so we can go long from the support line below and a target at 0.854 level.
Disclosure: I am part of Trade Nation's Influencer program and receive a monthly fee for using their TradingView charts in my analysis.
✅LIKE AND COMMENT MY IDEAS✅

Upward trend A trend change is expected to form within the current support area and initiate an uptrend. A break of the resistance trend line will confirm the continuation of the uptrend.

EURGBP FTMO DEMOAlthough a bearish trend but it is a bullish setup due to bullish divergence and a bullish harmonic pattern.

EURGBP Potential Bullish Bat PatternOn the daily chart, EURGBP fluctuated and fell in the short term, and the bears have the upper hand. The current price can focus on the vicinity of 0.8363, which is a potential buying position for the bullish bat pattern, and this position is in the previous demand area.

EURGBP SHORT FORECAST Q2 W20 D13 Y25EURGBP SHORT FORECAST Q2 W20 D13 Y25
Professional Risk Managers👋
Welcome back to another FRGNT chart update📈
Diving into some Forex setups using predominantly higher time frame order blocks alongside confirmation breaks of structure.
Let’s see what price action is telling us today!
💡Here are some trade confluences📝
✅Weekly order block
✅15' order block
✅Intraday bearish breaks of structure
✅Tokyo ranges to be filled
🔑 Remember, to participate in trading comes always with a degree of risk, therefore as professional risk managers it remains vital that we stick to our risk management plan as well as our trading strategies.
📈The rest, we leave to the balance of probabilities.
💡Fail to plan. Plan to fail.
🏆It has always been that simple.
❤️Good luck with your trading journey, I shall see you at the very top.
🎯Trade consistent, FRGNT X