EURGBP M15 viewRef....idea on EURGBP H4, There's absolutely no confirmation to take longs. I am mainly looking to take shorts if the price is to go up and a possible liquidity grab before the long-term shorts that I look to take; refer to the H4 idea. For now, I would like to see how the market will react to this imbalance when the market opens tomorrow.
EURGBP trade ideas

EURGBP Next weeks overview H4This will be my view on EURGBP for the upcoming weeks.
Do I really need to give a detailed description? I will see (lol), but I might actually be publishing more ideas on whatever that I am looking at, and mostly it might be HT ; that's HT for me as a day trader and swing trader. M15 will be for a closer view, I look for my entries on M5. Let's gooo!!!

EUR/GBP Breakout and Fibonacci Retest: Bullish Setup in PlayEUR/GBP has broken its strong weekly bearish trendline and the last lower high. The previously observed bullish divergence was hinting at this bullish momentum. Currently, the pair is testing the golden ratio of the Fibonacci retracement. A buy position can be considered at this level, targeting the recent highs.


EURGBPEURGBP long will .8650. Look at all pairs of GBP, clear indication of long trades. safe trade.

Eur/Gbp Elliott wave May/02 hello eveyone...
as you can see it seems wave 4 completed ( Holding 50% ) and wave 5 can start....

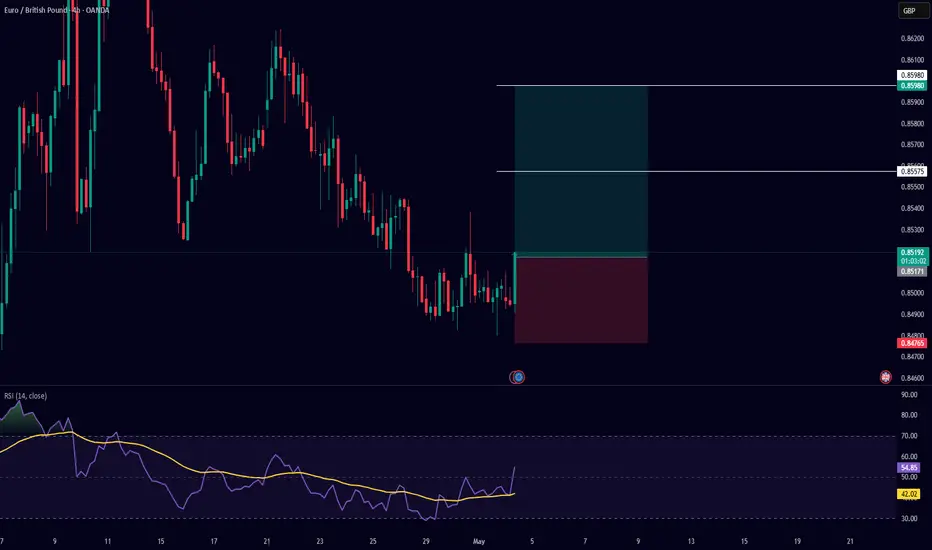
Trade Idea: EUR/GBP Long PositionTimeframe: 4H
Entry Price: ~0.85168
Trade Type: Buy (Long Position)
Technical Justification:
Bullish Reversal Setup: After an extended downtrend, price action has formed a potential reversal pattern with higher lows, indicating early signs of bullish momentum.
Break of Consolidation Zone: Price has broken above recent consolidation, suggesting a possible trend shift.
RSI Confirmation: The RSI (14) has crossed above its moving average and is currently above 50, supporting bullish momentum.
Risk-Reward Setup: The trade offers a favorable risk-to-reward ratio with a stop-loss set below recent lows at 0.84765 and a target near the previous resistance zone at 0.85980.
Trade Details:
Entry: 0.85168
Stop-Loss: 0.84765
Take-Profit: 0.85980
Risk-Reward Ratio: Approx. 1:2.5
Market Outlook:
This long setup aligns with potential bullish divergence and a structure break on the 4H chart, offering an ideal opportunity for swing traders anticipating a correction or trend reversal.
upterndThe price is expected to break through the resistance range and advance to the next resistance range.
If the price breaks through the green support zone, a downtrend is likely.

EURGBP is entering the buy zone. Ready to fly EURGBP is stuck sideway at 0.85 level and looking for liquidity to fly in my opinion.
Any dip below 0.85 level is an opportunity to enter long.
please do your own risk & reward.
Good luck

EURGBP | Long Opportunity with Strong Weekly SupportI'm watching EURGBP on the weekly timeframe as it approaches a strong support zone between 0.8200 and 0.8275 . The pair is currently in a corrective trend, signaling potential upside movement once the correction completes. The support zone has historically held well, indicating a potential rebound.
My stop-loss is placed at a weekly close below 0.8140 to protect against further downside. The first profit target is set at 0.8700, with the second target left open for potential extended gains depending on market conditions.

EURGBP INTRADAY supported at 0.8450EUR/GBP maintains a bullish bias, supported by the prevailing upward trend. Recent intraday movement indicates a corrective pullback toward a key consolidation zone, offering a potential setup for trend continuation.
Key Support Level: 0.8450 – previous consolidation range and pivotal support
Upside Targets:
0.8736 – initial resistance
0.8787 and 0.8900 – extended bullish targets on higher timeframes
A bullish reversal from 0.8500 would suggest continuation of the uptrend, confirming buying momentum.
However, a decisive break and daily close below 0.8500 would invalidate the bullish structure, opening the door for further retracement toward 0.8450, with additional support at 0.8370 and 0.8300.
Conclusion
EUR/GBP remains bullish above 0.8500. A bounce from this level supports further gains. Traders should watch for confirmation signals before positioning for the next move.
This communication is for informational purposes only and should not be viewed as any form of recommendation as to a particular course of action or as investment advice. It is not intended as an offer or solicitation for the purchase or sale of any financial instrument or as an official confirmation of any transaction. Opinions, estimates and assumptions expressed herein are made as of the date of this communication and are subject to change without notice. This communication has been prepared based upon information, including market prices, data and other information, believed to be reliable; however, Trade Nation does not warrant its completeness or accuracy. All market prices and market data contained in or attached to this communication are indicative and subject to change without notice.

Potential bearish drop?EUR/GBP has reacted off the pivot and could drop to the 1st support which acts as a pullback support.
Pivot: 0.8526
1st Support: 0.8447
1st Resistance: 0.8572
Risk Warning:
Trading Forex and CFDs carries a high level of risk to your capital and you should only trade with money you can afford to lose. Trading Forex and CFDs may not be suitable for all investors, so please ensure that you fully understand the risks involved and seek independent advice if necessary.
Disclaimer:
The above opinions given constitute general market commentary, and do not constitute the opinion or advice of IC Markets or any form of personal or investment advice.
Any opinions, news, research, analyses, prices, other information, or links to third-party sites contained on this website are provided on an "as-is" basis, are intended only to be informative, is not an advice nor a recommendation, nor research, or a record of our trading prices, or an offer of, or solicitation for a transaction in any financial instrument and thus should not be treated as such. The information provided does not involve any specific investment objectives, financial situation and needs of any specific person who may receive it. Please be aware, that past performance is not a reliable indicator of future performance and/or results. Past Performance or Forward-looking scenarios based upon the reasonable beliefs of the third-party provider are not a guarantee of future performance. Actual results may differ materially from those anticipated in forward-looking or past performance statements. IC Markets makes no representation or warranty and assumes no liability as to the accuracy or completeness of the information provided, nor any loss arising from any investment based on a recommendation, forecast or any information supplied by any third-party.

Wedge bullish breakoutl'm anticipating an upward breakout out of the wedge pattern but before the market buy im looking forward to see a false breakout to the downward and then reverse to the upward

EURGBP SHORT FORECAST Q2 W18 D1 Y25EURGBP SHORT FORECAST Q2 W18 D1 Y25
Professional Risk Managers👋
Welcome back to another FRGNT chart update📈
Diving into some Forex setups using predominantly higher time frame order blocks alongside confirmation breaks of structure.
Let’s see what price action is telling us today!
💡Here are some trade confluences📝
✅Weekly order block
✅15' order block
✅Intraday bearish breaks of structure
✅Tokyo ranges to be filled
🔑 Remember, to participate in trading comes always with a degree of risk, therefore as professional risk managers it remains vital that we stick to our risk management plan as well as our trading strategies.
📈The rest, we leave to the balance of probabilities.
💡Fail to plan. Plan to fail.
🏆It has always been that simple.
❤️Good luck with your trading journey, I shall see you at the very top.
🎯Trade consistent, FRGNT X

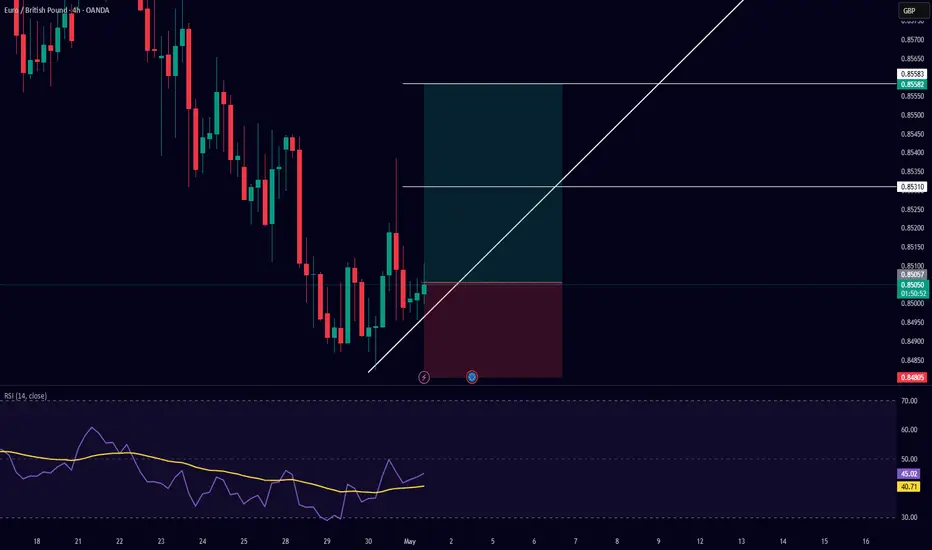
EUR/GBP Long Position (4H Timeframe)Analysis Summary:
The EUR/GBP pair has shown a potential bullish reversal on the 4-hour timeframe after forming a double-bottom structure near the 0.84800 support zone. A trendline has been drawn from recent higher lows, suggesting the initiation of an upward move.
Technical Indicators:
RSI (14): The RSI has broken above a descending trendline, indicating potential bullish momentum. Current RSI reading is 44.58, crossing above the signal line (40.68), hinting at growing bullish strength.
Price Action: A higher low is forming in confluence with trendline support, and recent bullish candles indicate buying pressure.
Trade Details:
Entry: 0.85042 (Current Market Price)
Take Profit (TP): 0.85583
Stop Loss (SL): 0.84805
Risk-to-Reward Ratio: Approximately 1:2
Conclusion:
This trade anticipates a continuation of the bullish move, backed by RSI breakout and trendline support. A clean invalidation below 0.84805 ensures risk management is in place, while the target at 0.85583 aligns with previous resistance.
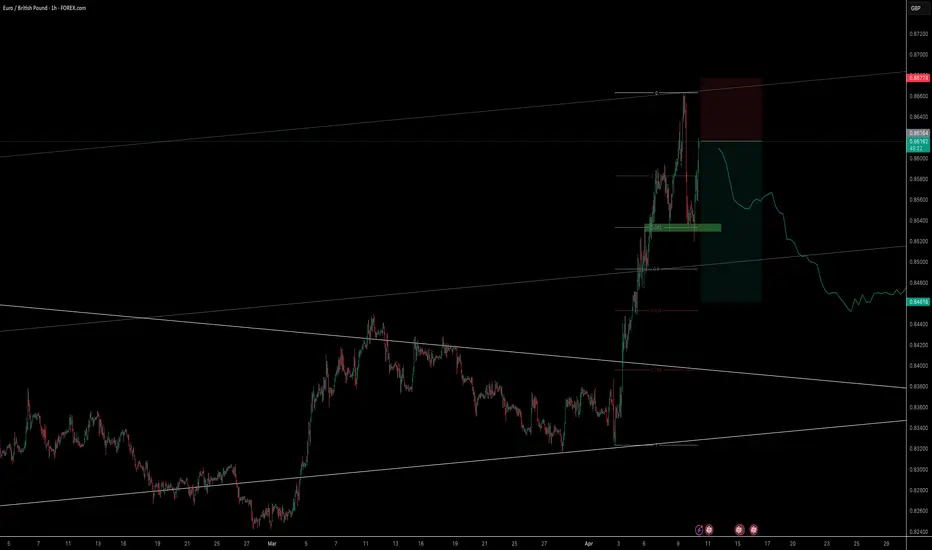
Shorts for EURGBPFX:EURGBP
Previously, we mentioned about the price having potential to react off the daily swap zone after falling from the daily resistance zone. However, price gave us only about 100 pips, before failing and breaking down below the daily swap zone. Since price previously reacted off the high time frame daily resistance zone, the break below of the swap zone signals continuous push towards the downside. Currently, price has reached the demand zone and price has rebounded. This zone may be seen as insignificant because, from the bearish price action, we expect it to eventually break below the demand zone and continue the downtrend towards the daily demand zone.

EURGBP H1 Strong UptrendEURGBP in 1 hour timeframe is in a strong uptrend. Any pullback with a complete corrective structure is a buy opportunity.

EUR/GBP For Bullish as pull-backwait for pull-back near by entry point and then go long
general trend is down trend
current phase is pull-back
have fun :)

EURGBP - Shorts/Sellsfor self Journaling purposes only, this does not constitute financial advice.
One a top forms and closes around the entry mark I will look to take sells. Detailed in the charts.
EUR/GBP Buy Trade Analysis – 4H Timeframe📈 Pair: EUR/GBP
🕒 Timeframe: 4-Hour
📥 Entry Price: 0.85112
🎯 Take Profit (TP): 0.86300 (approximate based on visual RR box)
🛑 Stop Loss (SL): 0.84786
🔍 Trade Setup Explanation:
Strong Support Zone: The price has bounced multiple times from the 0.84900–0.85000 support area, indicating buyer strength and market rejection of lower prices.
200 EMA Acting as Support: The blue 200-period EMA is providing dynamic support, aligning with the horizontal level and increasing the probability of a bullish move.
Bullish Reversal Candles: The recent bullish candles near support show strong buying interest, suggesting a shift in momentum.
EMA Crossover Potential: Price is testing the 50 EMA from below, and a break above could indicate a trend reversal or a deeper pullback.
RSI Confirmation: RSI has bounced from oversold levels and is now crossing above its signal line (moving average), signaling building bullish momentum.
💡 Summary:
This EUR/GBP long trade is supported by confluence of horizontal support, EMA dynamics (200 EMA support, 50 EMA pressure), and RSI bullish crossover. The setup offers a strong risk-to-reward profile with technical confirmation for a potential upside move.

Uptrend If the price breaks through the red resistance zone and the resistance trend line, the continuation of the uptrend is likely. Otherwise, the continuation of the downtrend is likely.

EURGBP DETAILED ANALYSIS TECHNICAL AND FUNDAMENTALSEURGBP is currently trading around 0.85, having completed a successful breakout and retest of the previous resistance-turned-support level. The price action aligns with a classic bullish continuation pattern, suggesting that the pair is poised for another upward move. My target for this bullish wave is 0.88, which corresponds to the next significant resistance zone.
Technical indicators support this outlook. The formation of a falling wedge pattern on the 4-hour chart has been confirmed, with the breakout leading to a sustained upward trajectory. The retest of the breakout level has held firm, indicating strong buyer interest and the potential for continued bullish momentum.
From a fundamental perspective, the euro is gaining strength due to improved economic indicators in the Eurozone, while the British pound faces headwinds amid ongoing fiscal policy uncertainties in the UK. This divergence in economic outlooks is contributing to the euro's relative strength against the pound, further supporting the bullish case for EURGBP.
In summary, the combination of technical patterns and fundamental factors suggests that EURGBP is well-positioned for a move toward 0.88. Traders should monitor key support levels to manage risk and look for confirmation of continued bullish momentum as the pair approaches the target zone.

EURGBP head and shoulders top pattern, pay attention to the neckOn the 4-hour chart, EURGBP formed a head-and-shoulders top pattern and then fell back in a shock. Short-term bears have the upper hand. Currently, you can pay attention to the neckline near 0.8520. If the rebound is blocked, you can consider shorting. The support below is around 0.8380.
