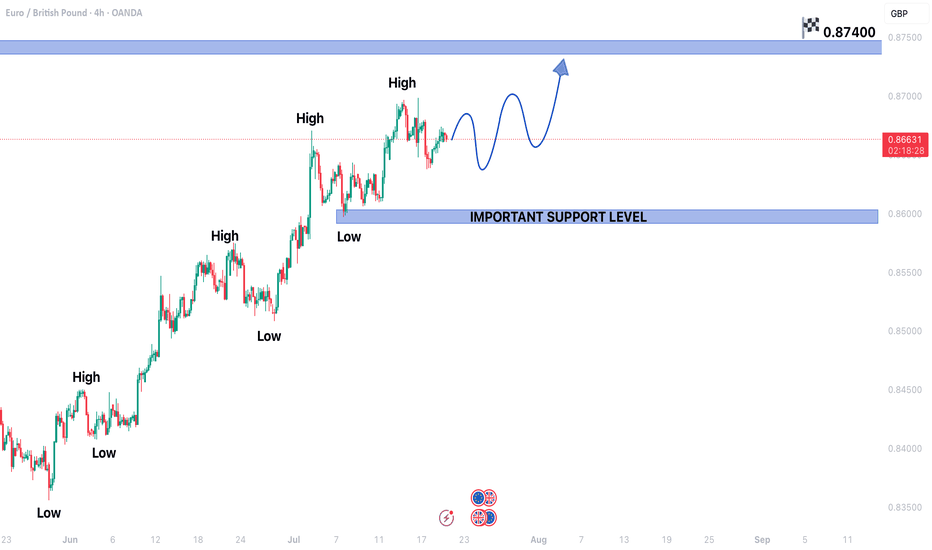
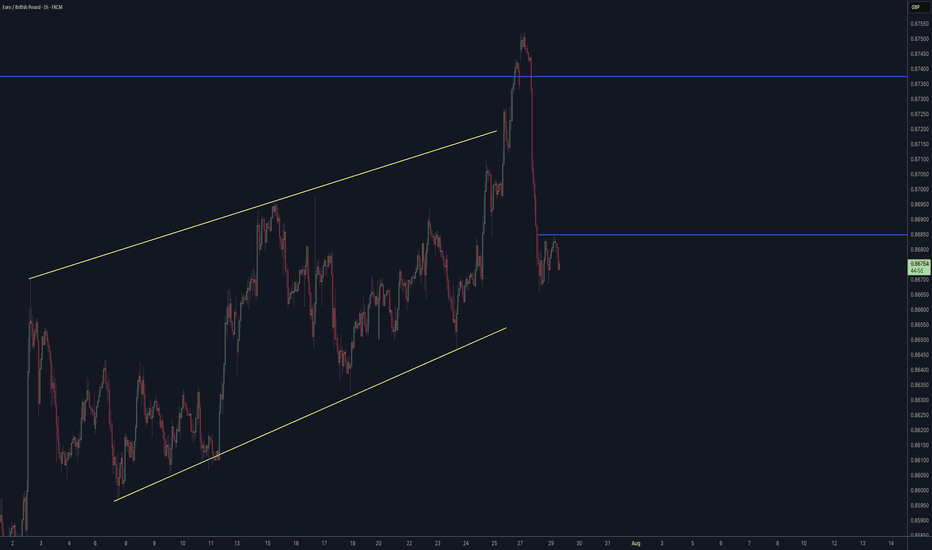
Eurgbp 26 MarPrice had reached lower channel and should be bullish at least for the short term Had loaded long positions here, will be looking for a break above resistant line for more bullish view to trigger Good luckLongby stanchiamUpdated 1
EURGBP BREAKOUT SELL *EUR/GBP: Breakout Sell *Trade Details:* - *Sell Entry:* Breakout below 0.83500 - *Target Price:* 0.82200 (130 pips) - *Stop-Loss:* 0.84415 (90 pips) *Market Analysis:* The EUR/GBP pair is experiencing a bearish trend, driven by Brexit uncertainty, ECB's dovish stance, and UK economic resilience. *Key Events:* - UK PMI data - ECB meeting minutes *Trading Strategy:* Sell EUR/GBP on breakout below 0.83500, with a stop-loss at 0.84415. Use target level to take profits or adjust stop-loss to break even. *Risk Management:* - Risk-Reward Ratio: 1:1.5 - Position Sizing: 2-3% of trading capital Remember the Travis with best wishes if you got it profitable 💯Shortby Expert_TravisUpdated 3
EUR-GBP Bearish Breakout! Sell! Hello,Traders! EUR-GBP made a bearish Breakout of key horizontal Level of 0.8353 so we are Bearish biased and after A potential pullback we will Be expecting a further Bearish move down Sell! Comment and subscribe to help us grow! Check out other forecasts below too! Disclosure: I am part of Trade Nation's Influencer program and receive a monthly fee for using their TradingView charts in my analysis.Shortby TopTradingSignals113
Time to buy EURGBPEURGBP at a strong demand area and now it is time to buy this pair. Risk rewards is 1:2 . Use money management always. Good luck with the trade !Longby realsupplydemandUpdated 2
EURGBP BUY BIAS We have a buy bias on this pair with multiple confluences 1) LIQ TAKEN 2) PIVOT AS SUPPORT 3) 200 EMA AS SUPPORT 4) RESISTANCE TURN SUPPORT 5) CANDLESTICKS SIGNALS We are targeting 0.84600 as our final target Longby RayForexlyfe2
"EUR/GBP Bearish Breakdown: Identifying Pump and Dump Patterns In the EUR/GBP currency pair, recent price action has exhibited characteristics reminiscent of a "pump and dump" scenario, marked by consistent breaks in market structure and a prevailing bearish trend.Short01:13by AfaqKhan111Updated 2
Price action A short term sell idea overall price is is still bullish a retracement is due back to neckline b4 continuing to upside Shortby wandilewie1
EURGBP: Long Signal with Entry/SL/TP EURGBP - Classic bullish pattern - Our team expects retracement SUGGESTED TRADE: Swing Trade Buy EURGBP Entry - 0.8353 Stop - 0.8326 Take - 0.8395 Our Risk - 1% Start protection of your profits from lower levels Disclosure: I am part of Trade Nation's Influencer program and receive a monthly fee for using their TradingView charts in my analysis. ❤️ Please, support our work with like & comment! ❤️ Longby UnitedSignals112
POTENTIAL LONG TRADE SET UP FOR EURGBPAnalysis: Utilizing chart patterns, highs & lows, and impulses & corrections, the focus is on identifying a continuation corrective structure following a breakout. The price approached the lower bound of a bullish continuation structure on the higher time frame (HTF) and immediately bounced with an impulse on the MTF. We will now monitor for a bullish impulse and continuation structure to identify a potential entry point for the trade. Expectation: A upward move is expected, targeting the peak of the HTF bullish continuation structure. ⚠️ Reminder: Always conduct your own analysis and apply proper risk management, as forex trading involves no guarantees. This is a high-risk activity, and past performance is not indicative of future results. Trade responsibly!Longby TheTradingAmbience1
eurgbp 27 Mar inverted head and shoulderA possible ihns is forming, loading some long and will load more when price closed above neckline Good luckLongby stanchiamUpdated 1
EUR/GBP 4H | Sell Opportunity After Resistance Rejection The EUR/GBP pair has been in a downtrend, with lower highs and lower lows forming. Recently, price rejected a key resistance zone and is now continuing its bearish momentum. 🔎 Key Observations: ✅ Resistance Levels: 0.83598 - 0.83910 acted as a strong rejection zone. ✅ Sell Confirmation: Price has broken below minor support and is now moving downward. ✅ Bearish Expectation: The next major support target is 0.82618. 📌 Trading Plan: 🔻 Sell on pullbacks near resistance levels (0.83598 - 0.83676). 🔻 Target: 0.82618 as the next key support. 🔻 Stop-loss: Above 0.83827 to minimize risk. 🚨 Risk Management Tip: Always maintain a good risk-reward ratio and wait for confirmations. 💬 What’s your take on this setup? Are you looking to sell or waiting for a better entry?Shortby PIPsOptimizer4
Euro / British Pound - 30 - OANDAThis chart represents the **Euro (EUR) / British Pound (GBP) currency pair on a 30-minute timeframe**, published on **TradingView**. It highlights a key **support area** and a potential **long (buy) trade setup**. ### **Key Elements in the Chart:** 1. **Support Area (Highlighted in Black Box)** - This region (~0.8345 - 0.8355) is marked as a key support zone where price has historically bounced. - Buyers are expected to enter at this level to push the price higher. 2. **Trade Setup:** - **Entry Zone:** Near the support area (~0.8355). - **Stop-Loss (SL):** Placed at **0.83510**, slightly below the support area, to limit downside risk. - **Take-Profit (Target):** Set at **0.8400**, where the price is expected to rise. - **Risk-to-Reward Ratio:** The trade aims for a favorable upside while keeping risk minimized. 3. **Background Colors & Highlights:** - Yellow background for the overall chart. - Green zone (above entry) represents the potential profit target. - Orange/red zone (below entry) represents the stop-loss level. ### **Possible Market Scenario:** - If price **holds above the support area**, a bullish move toward the **0.8400 target** is expected. - If price **breaks below the support area**, the trade may be invalidated, leading to a stop-loss trigger. This chart suggests a **bullish bias** based on support holding. Let me know if you need further insights! 🚀📈Longby ChartingMarketInsightsUpdated 3
DeGRAM | EURGBP correction in the channelEURGBP is in a descending channel between the trend lines. The price is moving from the lower boundary of the channel and dynamic support. The chart has formed a harmonic pattern and is now holding above the 38.2% retracement level. We expect the growth to the level of 0.84075. ------------------- Share your opinion in the comments and support the idea with like. Thanks for your support!Longby DeGRAM4414
Engulfing Candles: The Power ShiftIf there’s one candle pattern that represents an immediate shift in balance between buyers and sellers it is the engulfing candle. Today we take a deep dive into some of the key nuances of this pattern and explain how context and confirmation are essential elements to making this pattern a useful tool in your trading toolkit. Understanding the Engulfing Pattern The Engulfing candle pattern occurs when a single candlestick completely engulfs the body of the previous candle. In a bullish engulfing, a large bullish candle fully covers the smaller previous bearish candle, while in a bearish engulfing, a large bearish candle engulfs the previous bullish one. Within the space of a signal candle, the market has completely erased the previous candles price action and sometimes multiple prior candles price actions. This step change in momentum, is why it is often known as the ‘power shift pattern’ – when it is identified correctly can represent a key inflection point. Bullish Engulfing: A bullish engulfing suggests that after a period of selling, buying pressure has taken over, overpowering the bears in one strong move. This may indicate a potential reversal, from a bearish trend to a bullish one. Bearish Engulfing: A bearish engulfing indicates that after a period of buying, selling pressure has overwhelmed the bulls. This could signal a shift from an uptrend to a downtrend. Example: Nvidia Daily Candle Chart In this example, we see bullish and bearish engulfing candles form at the parameters of a range that formed on Nvidia’s daily candle chart. Past performance is not a reliable indicator of future results The Importance of Location and Context Like any chart pattern, the Engulfing candle is most effective when it occurs in the right context. Its location is crucial to its reliability. Trading the pattern within a range or consolidation zone can be misleading, as there may not be a clear prevailing trend for the pattern to reverse. For a bullish engulfing to be meaningful, it should ideally appear near a key support level, where buyers are likely to step in. In contrast, a bearish engulfing is more reliable when it appears near a key resistance level, where selling pressure may be about to take control. In short, location is everything. An engulfing pattern at a support or resistance level holds more weight than one formed in the middle of a range or without a clear market direction. Example: USD/CAD Daily Candle Chart In this example, we see small bearish engulfing candles form within a consolidation range. These are not significant signals as the location and context is sub-optimal. We then see a large engulfing candle form at the parameter of resistance – creating a clear bearish signal. Past performance is not a reliable indicator of future results Confirmation: The Next Candle is Key A major element to watch for with the Engulfing candle is confirmation. The next candle after the engulfing one should trade in the direction of the engulfing candle. For a bullish engulfing, the next candle should ideally close above the high of the engulfing candle. This confirms that the buying momentum is likely to continue. For a bearish engulfing, the next candle should ideally close below the low of the engulfing candle. This suggests that selling pressure is likely to persist. Without this confirmation, the pattern can be less reliable, and the initial move may not hold. The following candle helps validate whether the momentum shift is real or just a short-term fluctuation. Stop Placement Stop placement is a crucial aspect of trading the Engulfing pattern. Stops should generally be positioned just beyond the high or low of the engulfing candle, depending on the direction of the trade. For a bullish engulfing, place the stop below the low of the engulfing candle to allow for some movement without being stopped out prematurely. For a bearish engulfing, place the stop above the high of the engulfing candle to protect against any potential reversal or false breakouts. Placing stops in these locations helps manage risk while giving the trade enough room to develop, without exposing the position to unnecessary losses. The Engulfing Pattern Across Timeframes One of the advantages of the Engulfing candle is its versatility. It can be used effectively on any timeframe, from short-term intraday charts to long-term daily or weekly charts. On shorter timeframes, the Engulfing pattern may act as a signal for intraday trades, indicating a quick shift in momentum. On longer timeframes, the pattern could signal a larger, more sustained trend change, suggesting a longer-term move in the market. Regardless of the timeframe, the Engulfing candle remains an important pattern because it highlights a significant change in market sentiment, whether on a micro or macro scale. Final Thoughts The Engulfing candle is an effective pattern for identifying a shift in market momentum, either from bullish to bearish or vice versa. However, its effectiveness is heavily influenced by location and confirmation. When the pattern forms at a key support or resistance level and is followed by confirmation from the next candle, it can offer valuable insight into where the market may be headed. By combining these elements with good stop placement, traders can better manage risk and increase the reliability of the signals this pattern provides. Disclaimer: This is for information and learning purposes only. The information provided does not constitute investment advice nor take into account the individual financial circumstances or objectives of any investor. Any information that may be provided relating to past performance is not a reliable indicator of future results or performance. Social media channels are not relevant for UK residents. Spread bets and CFDs are complex instruments and come with a high risk of losing money rapidly due to leverage. 83% of retail investor accounts lose money when trading spread bets and CFDs with this provider. You should consider whether you understand how spread bets and CFDs work and whether you can afford to take the high risk of losing your money. Educationby Capitalcom116
EURGBP: Bullish Harmonic Pattern in a Strong ZoneEURGBP: Bullish Harmonic Pattern in a Strong Zone EURGBP has completed a bullish harmonic pattern within a robust zone. Despite this, the likelihood of the price testing the entire red zone remains high. It's crucial to be careful and closely monitor the price's reaction. Key resistance zones for the harmonic pattern are 0.8307, 0.8335, and 0.8370. You may find more details in the chart! Thank you and Good Luck! ❤️PS: Please support with a like or comment if you find this analysis useful for your trading day❤️ Disclosure: I am part of Trade Nation's Influencer program and receive a monthly fee for using their TradingView charts in my analysis.Longby KlejdiCuniUpdated 2217
Eur/Gbp LongWait for price to pull back to support before entering longs. Lower support area is good for entering longs too. First position can be taken at 0.83200 and second at 0.82240 SL under major lows TP at 0.86000 This is not a investment advice only idea. I am retailtrader without any education in economics. I trade my own money only. As always make your own analysis first.Longby VarisSvard111
EURGBP: Growth & Bullish Forecast It is essential that we apply multitimeframe technical analysis and there is no better example of why that is the case than the current EURGBP chart which, if analyzed properly, clearly points in the upward direction. Disclosure: I am part of Trade Nation's Influencer program and receive a monthly fee for using their TradingView charts in my analysis. ❤️ Please, support our work with like & comment! ❤️ Longby UnitedSignals112
Why eurgbp will sell this newyork session!!In my analysis, we are observing signs of weakness in the Euro, as indicated by recent candlestick formations that reflect a notable lack of buying pressure. This behavior appears to be aligning with key Fibonacci retracement levels, suggesting a potential transition towards lower price levels. I anticipate that in the pre-New York session, we may witness a temporary fake-out before a subsequent downward movement. Traders should exercise caution and consider these factors in their decision-making process Follow me for more breakdown!!by ShinForex12
EURGBP 24.03.2025~+ Germany Services PMI Miss, UK Services PMI Beat (mixed with good Mfg PMI and good FR data) + Bearish eur COT + Seasonality Shortby Cherry94Updated 1
EUR/GBP Analysis – Symmetrical Triangle Breakdown & Bearish MoveThis EUR/GBP chart on the 1-hour timeframe showcases a well-defined symmetrical triangle formation, a widely recognized pattern in technical analysis that signals potential breakout opportunities. The price action has respected the converging trendlines, indicating consolidation before a decisive move. Recently, the market has broken below the support zone, confirming a bearish breakdown and providing a strong signal for potential downside movement. This analysis will cover pattern formation, key technical levels, trading strategy, risk management, and future market outlook to provide a comprehensive professional breakdown of this setup. 1. Chart Pattern Analysis – Symmetrical Triangle Formation A symmetrical triangle consists of two converging trendlines that squeeze price action into a narrowing range, reflecting market indecision. This pattern is considered a continuation pattern, meaning that the price is likely to continue in the direction of the prevailing trend after the breakout. Pattern Characteristics in This Chart: ✅ Lower Highs: Price fails to break previous peaks, indicating weakening bullish momentum. ✅ Higher Lows: Buyers step in at higher points, preventing aggressive declines. ✅ Volume Decrease: Typical of consolidation within a symmetrical triangle. ✅ Breakout Confirmation: A strong bearish candle broke below the support level, signaling further downside potential. 2. Key Technical Levels & Zones 📌 Resistance Level + All-Time High (ATH) – 0.8421 This level represents the highest point in the pattern, where price faced repeated rejections. It aligns with a historical resistance zone, indicating a strong supply area. A breakout above this level would shift the market to a bullish bias. 📌 Support Level – 0.8379 (Now Acting as Resistance) Previously a key demand zone where buyers defended the price. Price has now broken below this level, confirming it as new resistance in a bearish scenario. A successful retest followed by rejection increases downside confirmation. 📌 Stop-Loss Placement – 0.8421 Located above the upper trendline and recent highs to avoid false breakouts. If price regains this level, the bearish scenario will be invalidated. 📌 Target Zone – 0.82926 (Major Support Area) This is the next strong support level, acting as a potential take-profit zone for short positions. It aligns with a previous price reaction area, making it a logical target for sellers. 3. Trading Setup & Strategy – Bearish Trade Plan The breakdown from the symmetrical triangle structure presents an opportunity to short the pair with a defined risk-to-reward setup. 📌 Entry Strategy: Enter short positions after price breaks and retests the 0.8379 support level as resistance. Confirmation should come from bearish candlestick patterns like engulfing candles or pin bars. 📌 Stop Loss: Placed above 0.8421, above the last swing high, to protect against potential false breakouts. 📌 Take Profit (TP) Target: First TP: 0.8325 (Intermediate support) Final TP: 0.82926 (Major support and key structure level) Alternative Scenario – Bullish Reversal Possibility If price reclaims 0.8379 and closes above it consistently, the bearish breakdown might be a false move. A move above 0.8421 would invalidate the bearish setup, leading to potential bullish momentum. 4. Risk Management & Trade Confirmation ✅ Volume Analysis A significant increase in volume on the breakdown strengthens the bearish outlook. Low volume retests may indicate a weak reversal attempt, favoring continuation downward. ✅ Bearish Price Action Confirmation Lower highs and consistent lower lows reinforce a bearish sentiment. Rejections from the broken support (now resistance) validate the trade setup. ✅ Risk-to-Reward Ratio (RRR) The Stop-Loss (SL) is tight, and the profit target is significantly larger, making this a high RRR trade. Ideally, a RRR of at least 2:1 or 3:1 should be maintained for proper risk control. 5. Market Sentiment & Future Outlook Bearish Bias Strengths: Trendline break indicates strong downside pressure. Failed attempts to break resistance suggest weakening bulls. Global macroeconomic factors and fundamental catalysts may favor GBP strength over EUR in the near term. Reversal Risks: A strong bullish breakout above 0.8421 would shift momentum to the upside. Fundamental news events (e.g., ECB or BoE statements) can impact market direction unexpectedly. 6. Summary & Conclusion 🔹 The EUR/GBP 1-hour chart has broken below a symmetrical triangle pattern, confirming a bearish breakout. 🔹 Key levels to watch: Resistance at 0.8421, support at 0.82926. 🔹 Trading strategy favors short positions, with a target at 0.82926 and a stop loss at 0.8421. 🔹 Confirmation comes from trendline breaks, volume analysis, and lower highs/lows structure. 📌 Final Verdict: The setup is bearish unless price reclaims 0.8379 and invalidates the structure. Traders should monitor price action, volume, and news events for further confirmations. 🔥 Potential Profit Target: 80-90 Pips 📉 ⚠️ Risk Management is Crucial – Always Use Stop Loss & Proper Position SizingShortby GoldMasterTrades112
Eurgbp 24 Mar 2025Nice risk reward ratio, pending price to close above resistant line to confirm and spike higher Good luckby stanchiamUpdated 1
EURGBP INTRADAY sideways consolidation capped at 0.8420The EUR/GBP pair continues to exhibit bearish sentiment, reinforced by the prevailing downtrend. The key intraday resistance level is at 0.8420, marking the current swing high. Bearish Scenario: An oversold rally from current levels, followed by a bearish rejection at 0.8420, would likely target downside support at 0.8353. A break below this level would open the door for further declines toward 0.8335 and 0.8300 in the longer timeframe. Bullish Scenario: Alternatively, a confirmed breakout above the 0.8420 resistance, accompanied by a daily close above this level, would invalidate the bearish outlook. This would pave the way for further rallies, with the next resistance levels at 0.8450 and 0.8490. Conclusion: The prevailing sentiment remains bearish as long as 0.8420 holds as resistance. Traders should watch for rejection at this level to confirm downside momentum. Conversely, a decisive breakout above 0.8420 would signal a potential shift to a bullish bias, targeting higher resistance levels. This communication is for informational purposes only and should not be viewed as any form of recommendation as to a particular course of action or as investment advice. It is not intended as an offer or solicitation for the purchase or sale of any financial instrument or as an official confirmation of any transaction. Opinions, estimates and assumptions expressed herein are made as of the date of this communication and are subject to change without notice. This communication has been prepared based upon information, including market prices, data and other information, believed to be reliable; however, Trade Nation does not warrant its completeness or accuracy. All market prices and market data contained in or attached to this communication are indicative and subject to change without notice. by TradeNation2
EUR/GBP Chart Analysis – Inverse Head & Shoulders Bullish SetupThis EUR/GBP 1-hour chart showcases a classic Inverse Head & Shoulders (H&S) pattern, signaling a potential trend reversal from bearish to bullish. This pattern is considered one of the most reliable technical formations for spotting upcoming upward momentum, particularly after a prolonged downtrend. 🔎 Market Overview Currency Pair: EUR/GBP Timeframe: 1-Hour (H1) Current Price: 0.83720 Trend: Transitioning from a downtrend to a potential bullish breakout Key Pattern: Inverse Head & Shoulders Trading Bias: Bullish (Pending breakout confirmation) 📊 Chart Breakdown & Technical Analysis 1️⃣ Market Structure & Trend Analysis Before the formation of the Inverse Head & Shoulders, the market was in a strong downtrend, making lower highs and lower lows. However, buyers started stepping in near the 0.8350 level, preventing further decline. This rejection at key support has set the stage for a potential trend reversal. Left Shoulder: Price formed a minor low around 0.8370, followed by a small bounce. Head: Price made a deeper low around 0.8351, confirming strong support and buyer interest. Right Shoulder: Price attempted another dip but failed to break below the previous low, forming a higher low near 0.8370, signaling increasing bullish pressure. Neckline Resistance: 0.8385 - 0.8390 zone – a crucial level that price needs to break for confirmation of an uptrend. 2️⃣ Key Support & Resistance Levels Support Level: 0.83513 (Major demand zone) Resistance Levels: Neckline: 0.8385 - 0.8390 (Breakout confirmation zone) Major Resistance: 0.84308 (Target level) Curve Zone: A dynamic resistance trendline that has been containing price action. A breakout above this curve signals a potential shift in trend. 📈 Trading Strategy – Bullish Breakout Plan ✅ Entry Strategy: A long trade should be considered only after a confirmed breakout above the neckline (0.8385 - 0.8390). The confirmation comes when: A strong bullish candle closes above the neckline. Increased trading volume supports the breakout. A possible retest of the neckline as new support (0.8385) before continuation. 🎯 Target Price & Stop Loss: Take Profit (TP): 0.84308 (Projected move based on pattern size). Stop Loss (SL): Below 0.83513 (Right Shoulder low). Risk-to-Reward Ratio (RRR): 1:2 or higher, making this a high-probability trade setup. 🛑 Risk Management & Trade Confirmation: Volume Confirmation: A breakout should be accompanied by a volume spike, confirming strong buyer interest. Fakeout Warning: If price briefly breaks above the neckline but then falls back below, it could be a false breakout. In this case, waiting for a retest would be a safer approach. Trailing Stop: Once price moves toward 0.8410, a trailing stop can help secure profits in case of market reversals. 🧐 Summary – Key Takeaways ✅ Inverse Head & Shoulders Identified – A reliable bullish reversal pattern. ✅ Breakout Zone: 0.8385 - 0.8390 (Watch for confirmation). ✅ Target Price: 0.84308 (Potential profit zone). ✅ Stop Loss: Below 0.83513 (Protect against downside risk). ✅ Risk-to-Reward Ratio: Favorable (1:2 or better). ✅ Trading Plan: Buy above the neckline, aim for 0.8430, and manage risk properly. 📌 Final Thought: If the neckline is broken with strong momentum, expect a bullish move toward 0.8430+. However, traders should remain cautious of potential fakeouts and manage risk accordingly. 📢 Share your thoughts in the comments! Are you bullish on EUR/GBP? 🚀📊 #EURGBP #ForexTrading #TechnicalAnalysis #TradingSetup #InverseHeadAndShouldersLongby GoldMasterTrades1