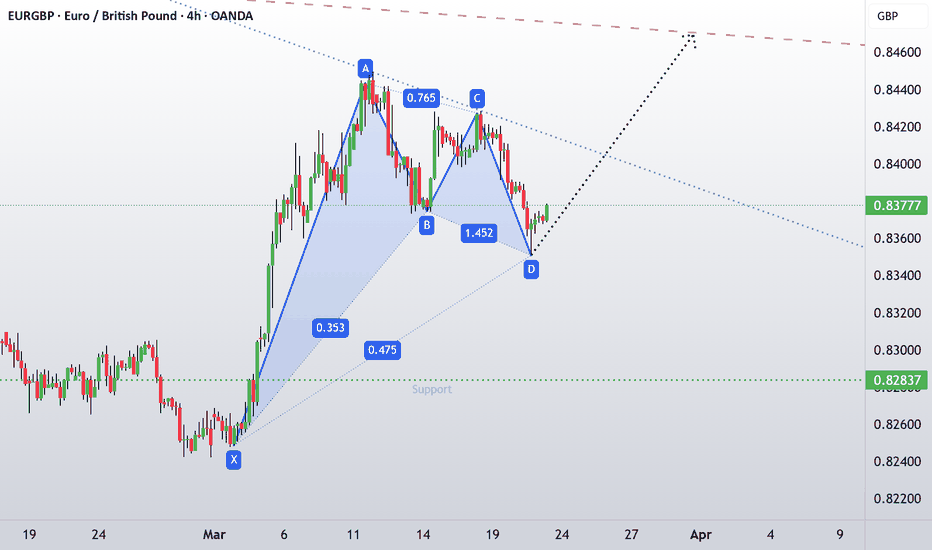
Bullish bounce?EUR/GBP is reacting off the pivot and could bounce to the 1st resistance.
Pivot: 0.8337
1st Support: 0.8310
1st Resistance: 0.8377
Risk Warning:
Trading Forex and CFDs carries a high level of risk to your capital and you should only trade with money you can afford to lose. Trading Forex and CFDs may not be suitable for all investors, so please ensure that you fully understand the risks involved and seek independent advice if necessary.
Disclaimer:
The above opinions given constitute general market commentary, and do not constitute the opinion or advice of IC Markets or any form of personal or investment advice.
Any opinions, news, research, analyses, prices, other information, or links to third-party sites contained on this website are provided on an "as-is" basis, are intended only to be informative, is not an advice nor a recommendation, nor research, or a record of our trading prices, or an offer of, or solicitation for a transaction in any financial instrument and thus should not be treated as such. The information provided does not involve any specific investment objectives, financial situation and needs of any specific person who may receive it. Please be aware, that past performance is not a reliable indicator of future performance and/or results. Past Performance or Forward-looking scenarios based upon the reasonable beliefs of the third-party provider are not a guarantee of future performance. Actual results may differ materially from those anticipated in forward-looking or past performance statements. IC Markets makes no representation or warranty and assumes no liability as to the accuracy or completeness of the information provided, nor any loss arising from any investment based on a recommendation, forecast or any information supplied by any third-party.
EURGBP trade ideas
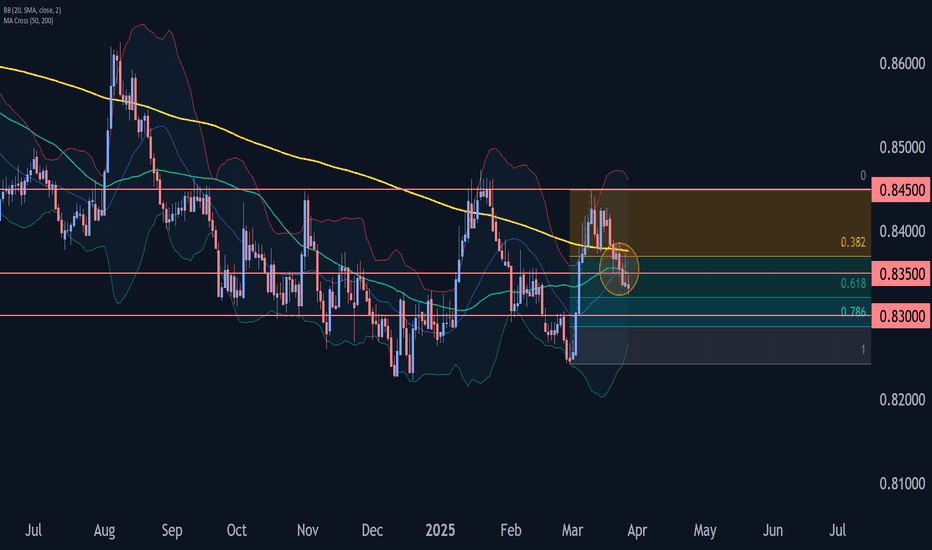
EURGBP Wave Analysis – 27 March 2025
- EURGBP broke support area
- Likely to fall to support level 0.8300
EURGBP currency pair recently broke the support area between the key support level 0.8350 (which has been reversing the price from the start of March) and the 38.2% Fibonacci correction of the upward wave 2 from the end of February.
The breakout of this support area accelerated the active impulse wave iii of the higher impulse waves 3 and (3).
Given the strongly bullish sterling sentiment, EURGBP currency pair can be expected to fall to the next support level 0.8300.
EURGBP BREAKOUT SELL *EUR/GBP: Breakout Sell
*Trade Details:*
- *Sell Entry:* Breakout below 0.83500
- *Target Price:* 0.82200 (130 pips)
- *Stop-Loss:* 0.84415 (90 pips)
*Market Analysis:*
The EUR/GBP pair is experiencing a bearish trend, driven by Brexit uncertainty, ECB's dovish stance, and UK economic resilience.
*Key Events:*
- UK PMI data
- ECB meeting minutes
*Trading Strategy:*
Sell EUR/GBP on breakout below 0.83500, with a stop-loss at 0.84415. Use target level to take profits or adjust stop-loss to break even.
*Risk Management:*
- Risk-Reward Ratio: 1:1.5
- Position Sizing: 2-3% of trading capital
Remember the Travis with best wishes if you got it profitable 💯
EURGBP: Bearish Outlook Explained 🇪🇺🇬🇧
A recent breakout of a minor daily support on EURGBP
is a reliable bearish signal.
It shows a mid-term dominance of the sellers.
I think that the price can drop at least to 0.831 support soon.
❤️Please, support my work with like, thank you!❤️
I am part of Trade Nation's Influencer program and receive a monthly fee for using their TradingView charts in my analysis.
EURGBP Set To Fall! SELL!
My dear friends,
EURGBP looks like it will make a good move, and here are the details:
The market is trading on 0.8359 pivot level.
Bias - Bearish
Technical Indicators: Supper Trend generates a clear short signal while Pivot Point HL is currently determining the overall Bearish trend of the market.
Goal - 0.8344
About Used Indicators:
Pivot points are a great way to identify areas of support and resistance, but they work best when combined with other kinds of technical analysis
Disclosure: I am part of Trade Nation's Influencer program and receive a monthly fee for using their TradingView charts in my analysis.
———————————
WISH YOU ALL LUCK
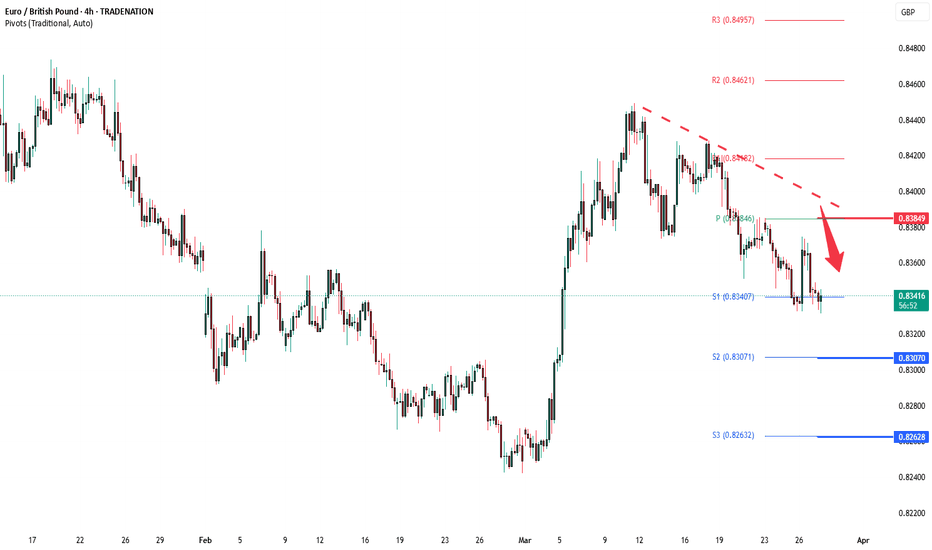
EURGBP INTRADAY corrective pullback capped at 0.8385The EUR/GBP pair continues to exhibit bearish sentiment, reinforced by the prevailing downtrend. The key intraday resistance level is at 0.8385, marking the current swing high.
Bearish Scenario:
An oversold rally from current levels, followed by a bearish rejection at 0.8385, would likely target downside support at 0.8340. A break below this level would open the door for further declines toward 0.8307 and 0.8260 in the longer timeframe.
Bullish Scenario:
Alternatively, a confirmed breakout above the 0.8385 resistance, accompanied by a daily close above this level, would invalidate the bearish outlook. This would pave the way for further rallies, with the next resistance levels at 0.8420 and 0.8460.
Conclusion:
The prevailing sentiment remains bearish as long as 0.8385 holds as resistance. Traders should watch for rejection at this level to confirm downside momentum. Conversely, a decisive breakout above 0.8420 would signal a potential shift to a bullish bias, targeting higher resistance levels.
This communication is for informational purposes only and should not be viewed as any form of recommendation as to a particular course of action or as investment advice. It is not intended as an offer or solicitation for the purchase or sale of any financial instrument or as an official confirmation of any transaction. Opinions, estimates and assumptions expressed herein are made as of the date of this communication and are subject to change without notice. This communication has been prepared based upon information, including market prices, data and other information, believed to be reliable; however, Trade Nation does not warrant its completeness or accuracy. All market prices and market data contained in or attached to this communication are indicative and subject to change without notice.
DeGRAM | EURGBP rebound in the channelEURGBP is in a descending channel between the trend lines.
The price is moving from the lower boundary of the channel and the support level.
The chart holds the support level, which has already acted as a rebound point.
We expect a rise after consolidation above the nearest retracement level.
-------------------
Share your opinion in the comments and support the idea with like. Thanks for your support!
EURGBP, time to short ! price declined from a supply zone and made a made a clean break and retest on the structure zone, by looking at EMAs (21,50 and 200) we can clearly see that price has broke through them with a strong bearish candle, and currently price is trading below moving averages indicating a bearish control in the market, I expect price to continue down
EURGBP Analysis: Weak CPI Triggers Reaction from Order BlockWe can observe that the UK CPI y/y has dropped to 2.8% from 3.0%, signaling potential weakness in GBP. On the technical side, price is reacting from a key Order Block, failing to break further to the downside. While the overall trend remains bearish, this marks the third push downward—a classic signal for a possible reversal. If buyers step in, we could see a shift in momentum. Monitoring price action at this level is crucial for the next move.
POTENTIAL LONG TRADE SET UP FOR EURGBPAnalysis: Utilizing chart patterns, highs & lows, and impulses & corrections, the focus is on identifying a continuation corrective structure following a breakout.
The price approached the lower bound of a bullish continuation structure on the higher time frame (HTF) and immediately bounced with an impulse on the MTF. We will now monitor for a bullish impulse and continuation structure to identify a potential entry point for the trade.
Expectation: A upward move is expected, targeting the peak of the HTF bullish continuation structure.
⚠️ Reminder: Always conduct your own analysis and apply proper risk management, as forex trading involves no guarantees. This is a high-risk activity, and past performance is not indicative of future results. Trade responsibly!
DeGRAM | EURGBP rebound from the lower boundary of the channelEURGBP is in a descending channel above the trend lines.
The price is moving from the lower boundary of the channel.
The chart has consolidated above the dynamic resistance and the 50% correction level.
We expect the rebound to continue.
-------------------
Share your opinion in the comments and support the idea with like. Thanks for your support!
EUR/GBP Chart Analysis – Double Bottom Reversal & Breakout Setup1. Market Structure & Context
The EUR/GBP daily chart presents a well-defined double bottom reversal pattern, indicating a potential trend shift from a prolonged downtrend to an uptrend.
The pair has been in a bearish phase, as reflected by the descending trendline.
However, price action suggests a possible trend reversal, as buyers are stepping in near a key demand zone.
A successful neckline breakout would confirm the bullish reversal, potentially leading to significant upside movement.
2. Key Chart Patterns & Technical Levels
A. Double Bottom Formation (Bullish Reversal Pattern)
The double bottom is a powerful reversal pattern, often signaling the end of a downtrend. It consists of two similar low points, forming a "W" shape.
Bottom 1: The first low was established around 0.8200 - 0.8250, where buyers initially stepped in to push prices higher.
Bottom 2: Price retested this demand zone, but sellers failed to push it lower, confirming a strong support level.
Bullish Significance: The inability of sellers to break below the support zone suggests the exhaustion of selling pressure and increasing buy-side interest.
B. Neckline Resistance & Potential Breakout Zone
The neckline resistance is drawn around 0.8450 - 0.8500, a key level where previous price rallies were rejected.
A breakout above this zone, ideally with strong bullish volume, would validate the double bottom pattern and trigger a bullish breakout trade.
C. Descending Trendline Breakout Attempt
The long-term downtrend resistance (trendline) has been holding since mid-2024.
Price is currently testing this trendline; a clear breakout and retest would add further confidence to the bullish bias.
3. Trade Setup & Execution Plan
A. Entry Strategy
There are two possible entry strategies, depending on risk appetite:
Aggressive Entry: Buy immediately upon a breakout above 0.8500, anticipating a strong rally.
Conservative Entry: Wait for a breakout + retest of the neckline before entering, ensuring confirmation.
B. Stop Loss & Risk Management
Stop Loss (SL): Placed below the recent swing low at 0.82029.
This level acts as the last line of defense for bulls; if price drops below it, the bullish thesis is invalidated.
C. Take Profit (TP) Targets
TP1: 0.86122 (first resistance zone, a previous swing high).
TP2: 0.87284 (higher resistance level, next supply zone).
These levels serve as potential profit-taking areas where sellers may re-enter the market.
4. Additional Technical Confluences Supporting Bullish Bias
✔ Key Support Zone Holding Strong – The price has bounced twice from the demand zone (0.8200 - 0.8250), confirming strong buyer interest.
✔ Volume Confirmation Needed – A breakout with high volume increases the probability of sustained bullish momentum.
✔ RSI & Momentum Indicators – If RSI crosses above 50, it would further confirm bullish momentum, supporting the breakout trade.
✔ Favorable Risk-to-Reward Ratio (RRR) – A well-defined stop loss & take profit strategy ensures an optimal trade setup.
5. Summary & Final Trading Plan
Current Market Bias: Bullish if neckline breaks (Double Bottom Confirmation).
Entry Confirmation: Look for a breakout above 0.8500 with strong volume.
Profit Targets:
TP1: 0.8612
TP2: 0.8728
Stop-Loss Level: Below 0.8202 to protect against fake breakouts.
🚀 Final Tip for Traders:
Monitor price action & volume closely. A breakout without volume may lead to a false move. Confirmation with bullish momentum is essential for a high-probability trade setup.
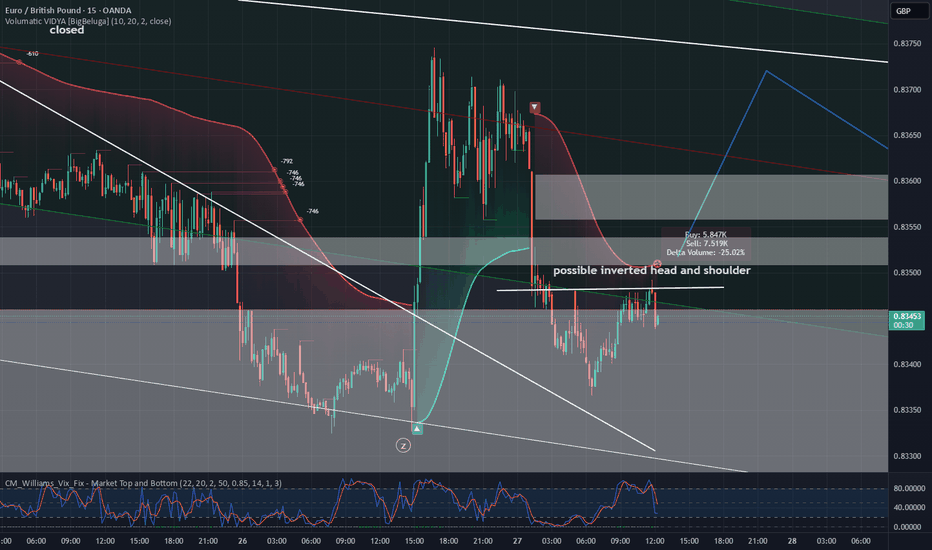
Retracement of EURGBP Expected after data .Shorting EURGBP at 0.8368 after this morning's data
200 Hourly EMA providing technical resistance
Running into a cluster of previous volume areas
Overall recent trend is still bearish .
Despite the data this morning giving GBP a push lower , this move appears way too aggressive for the data and likely more position covering than fundamental given that :
Bank of England still expect inflation to peak at 3.75% in Q3
Energy , Tarriffs and general uncertainty in the market
Some analyst still calling for 4% in April and May
I think perhaps a high probability reversal here from the overstretch -as always I'll look for a quick trade with good risk reward .
Stop 0.8392
Entry 0.8368
Target 0.8328
E.
EUR-GBP Bearish Breakout! Sell!
Hello,Traders!
EUR-GBP made a bearish
Breakout of key horizontal
Level of 0.8353 so we are
Bearish biased and after
A potential pullback we will
Be expecting a further
Bearish move down
Sell!
Comment and subscribe to help us grow!
Check out other forecasts below too!
Disclosure: I am part of Trade Nation's Influencer program and receive a monthly fee for using their TradingView charts in my analysis.
EUR/GBP 4H | Sell Opportunity After Resistance Rejection The EUR/GBP pair has been in a downtrend, with lower highs and lower lows forming. Recently, price rejected a key resistance zone and is now continuing its bearish momentum.
🔎 Key Observations:
✅ Resistance Levels: 0.83598 - 0.83910 acted as a strong rejection zone.
✅ Sell Confirmation: Price has broken below minor support and is now moving downward.
✅ Bearish Expectation: The next major support target is 0.82618.
📌 Trading Plan:
🔻 Sell on pullbacks near resistance levels (0.83598 - 0.83676).
🔻 Target: 0.82618 as the next key support.
🔻 Stop-loss: Above 0.83827 to minimize risk.
🚨 Risk Management Tip: Always maintain a good risk-reward ratio and wait for confirmations.
💬 What’s your take on this setup? Are you looking to sell or waiting for a better entry?


