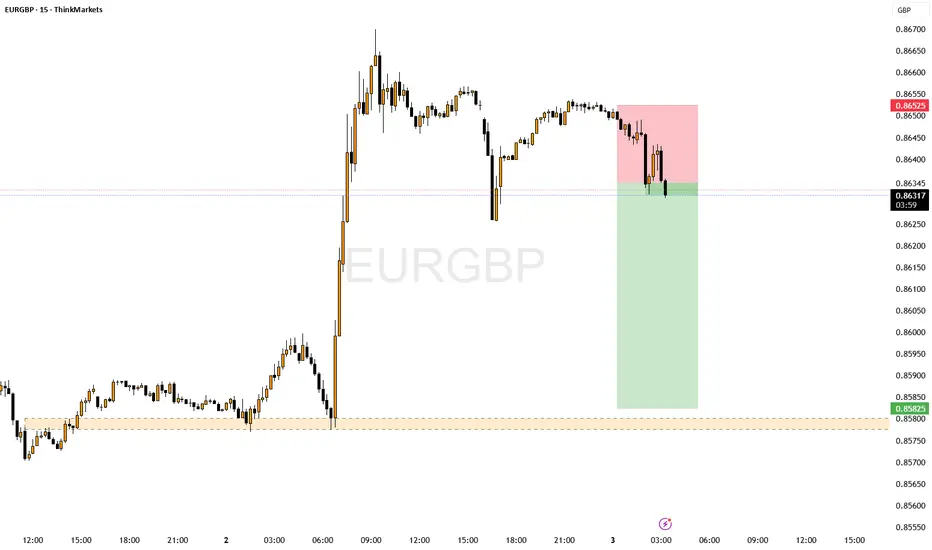
EURGBP AnalysisPrice has reached its true average and has shown a large amount of supply side volume, therefore I'm looking to short at this price level. It could consolidate later when the London/New York crossover happens.
EURGBP trade ideas

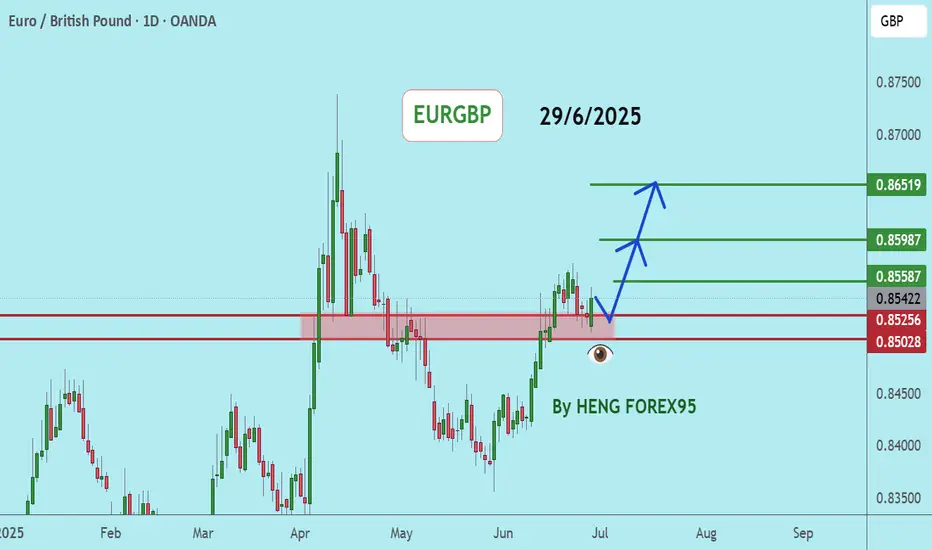
EURGBPEURGBP If the price can stay above 0.85028, it is likely to increase.
Consider buying the red zone.
🔥Trading futures, forex, CFDs and stocks carries a risk of loss.
Please consider carefully whether such trading is suitable for you.
>>GooD Luck 😊
❤️ Like and subscribe to never miss a new idea!
EURGBP sell Opportunity 1:3 Risk rewards , IT is time to sell the EURGBP from the resistance area. price is resistance in this zone for several times and it gave the downwards signal . Do not risk more than 1% from your capital .

EUR_GBP BULLISH BIAS|LONG|
✅EUR_GBP broke the key
Structure level of 0.8620
While trading in an local uptrend
Which makes me bullish
And I think that after the retest
Of the broken level is complete
A rebound and bullish continuation will follow
LONG🚀
✅Like and subscribe to never miss a new idea!✅
Disclosure: I am part of Trade Nation's Influencer program and receive a monthly fee for using their TradingView charts in my analysis.

EURGBPHigher Highs (HH) & Higher Lows (HL): The pattern of higher highs and higher lows is an indication of an uptrend, showing that the buying momentum is strong.
Entry: Place a buy stop order just above the recent higher high (HH). This allows you to enter the trade if the price continues moving upward, confirming the bullish momentum.

EURGBP Growth Ahead!
HI,Traders !
#EURGBP is trading along the
Rising support and is already
Making a bullish rebound so
AsTo the strong uptrend we
Will be expecting a further
Bullish move up on pair !
Comment and subscribe to help us grow !

EURGBP Wave Analysis – 2 July 2025- EURGBP broke resistance zone
- Likely to rise to resistance level 0.8700
EURGBP currency pair recently broke the resistance zone between the resistance level 0.8570 (which stopped the previous impulse wave i at the end of June) and the 61.8% Fibonacci correction of the downward impulse (B) from April.
The breakout of this resistance zone accelerated the active minor impulse wave 3 of the intermediate impulse wave (C) from May.
EURGBP currency pair can be expected to rise to the next resistance level 0.8700 (which is intersecting with the daily up channel from May).

EURGBP: Weak Market & Bearish Forecast
Our strategy, polished by years of trial and error has helped us identify what seems to be a great trading opportunity and we are here to share it with you as the time is ripe for us to sell EURGBP.
Disclosure: I am part of Trade Nation's Influencer program and receive a monthly fee for using their TradingView charts in my analysis.
❤️ Please, support our work with like & comment! ❤️

EurgbpClean analysis on this pair feel free to hop on it apply proper risk management set TP at 1:3 or more
Enjoy 🥂
Check the trend It is expected that after some fluctuation and correction, we will see the continuation of the uptrend. Otherwise, the correction will advance to the specified time frame, then an uptrend will be possible.

The Day AheadWednesday, July 2 – Key Highlights:
US ADP Employment Report (June): A crucial preview to Friday’s NFP; strong numbers may delay Fed cuts, weak data could boost cut expectations.
Eurozone Labor Market Data (May): Italy and Eurozone unemployment rates will offer insight into the region’s economic resilience; deterioration may weigh on ECB sentiment.
Japan Monetary Base (June): Watch for shifts in liquidity trends as the BoJ cautiously normalizes policy.
France Budget Balance (May): A worsening fiscal position could raise concerns amid ongoing political uncertainty.
Canada Manufacturing PMI (June): A weak print would reinforce the case for continued BoC rate cuts.
Central Bank Watch:
ECB: Lagarde, Guindos, Cipollone, and Lane speak; markets will look for clues on inflation and rate path.
BoE: Taylor (or another senior official) speaks; comments may impact UK rate expectations ahead of the election.
Market Focus:
Labor market and fiscal data, paired with a heavy central bank speaker lineup, will guide rate cut expectations and shape cross-asset risk sentiment.
This communication is for informational purposes only and should not be viewed as any form of recommendation as to a particular course of action or as investment advice. It is not intended as an offer or solicitation for the purchase or sale of any financial instrument or as an official confirmation of any transaction. Opinions, estimates and assumptions expressed herein are made as of the date of this communication and are subject to change without notice. This communication has been prepared based upon information, including market prices, data and other information, believed to be reliable; however, Trade Nation does not warrant its completeness or accuracy. All market prices and market data contained in or attached to this communication are indicative and subject to change without notice.

Weekly Uptrend, Daily Uptrend, H4 Uptrend - It's a BUY????All the information you need to find a high probability trade are in front of you on the charts so build your trading decisions on 'the facts' of the chart NOT what you think or what you want to happen or even what you heard will happen. If you have enough facts telling you to trade in a certain direction and therefore enough confluence to take a trade, then this is how you will gain consistency in you trading and build confidence. Check out my trade idea!!
www.tradingview.com

EURGBP Market Structure Analysis on 4H and M15 Timeframes4H swing is bearish => current is pullback
M15 swing is bullish
We can look for short selling opportunities if the bottom of M15 is broken

EURGBP short trade Idea with divergence 💶 EURGBP SHORT SETUP – Clean Supply Rejection 📉🔥
Looking at a fresh opportunity to short EURGBP based on recent price action and structure:
🔹 Market Context:
Price recently pushed into a key supply zone or resistance around 0.84800–0.85000.
Multiple rejections spotted at that level – suggesting weak bullish momentum and engineered liquidity.
🔹 Setup Bias: Bearish
We’re anticipating a short-term correction or continuation to the downside, targeting recent demand zones or imbalances.
🔹 Trade Setup (Example):
Entry: ~0.84800
Stop Loss: ~0.85100 (above supply wick)
Take Profit: ~0.84100 (demand/imbalance fill area)
Risk to Reward: ~1:3 potential
🔹 Confluences:
Rejection candle at supply
Divergence
Price broke structure (BOS) to the downside earlier
Overbought signals (if using RSI/Stoch)
Clean imbalance zone below
📊 Execution Tip:
Wait for confirmation (M15 bearish engulfing / lower high break) to avoid early entries.
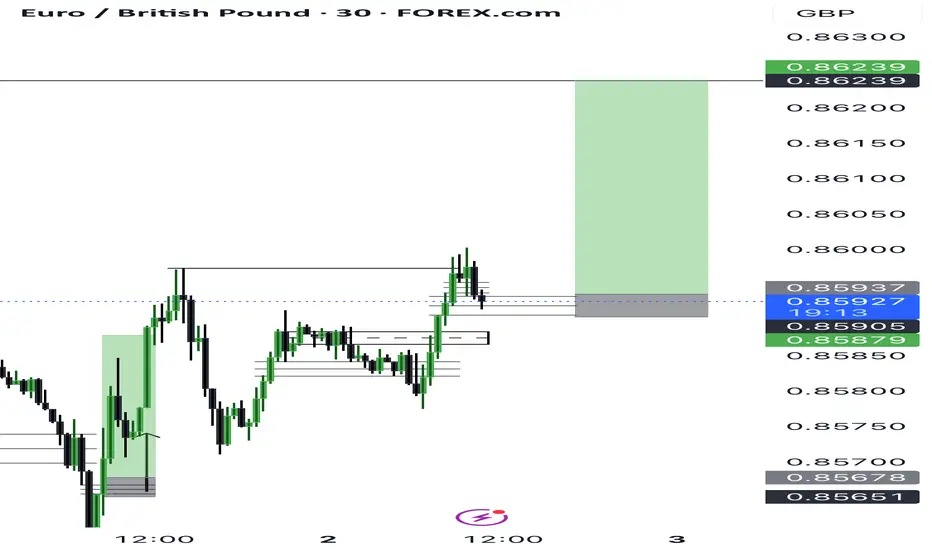
EURGBP sell, July 01HTF shows strong bullish trend, with price barely missing the Daily imbalance — signaling strong buyer momentum and no clear reversal point nearby.
On LTF, we had a clean 15m BOS, confirming bullish continuation, and price reacted from a 15m POI with imbalance left behind.
First entry missed by 1 pip, but it’s still in play — second entry aligns with the same narrative.
📍Entry: 15m imbalance
🧠 BOS in our favor, valid setup if triggered before London close
🎯 TP: Asia high for 1:3 RR
📉 Risk: 0.5% on each position
Looking to continue the upside trend, staying patient and letting price come to us.

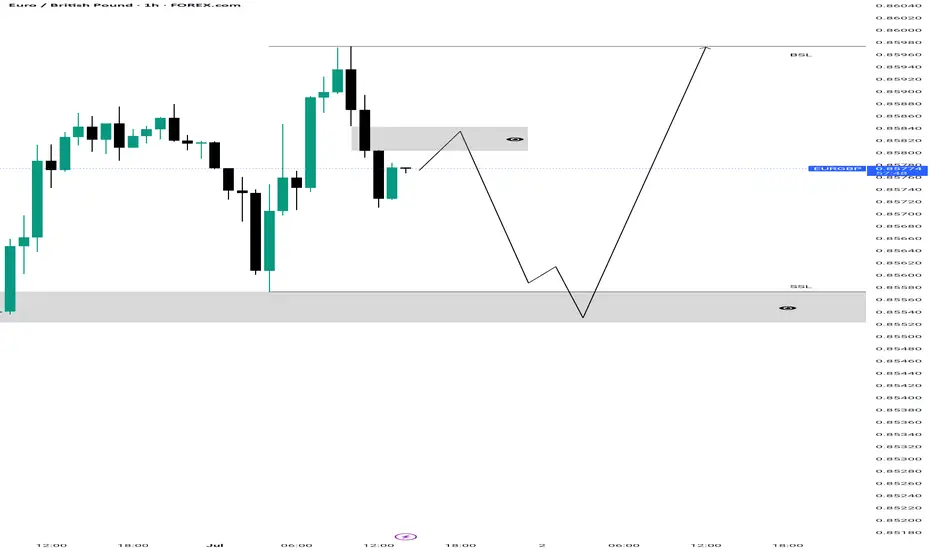
EURGBP Watching the FVG for a Possible Push HigherEURGBP has been showing a clean bullish structure on the 1 hour chart. We got a solid break of structure that left behind an imbalance and price is now pulling back.
There’s a fair value gap just above the previous day’s low and also some local liquidity resting below the last minor low. If price dips into that FVG, fills the imbalance and takes out a bit more liquidity, it could set up the next move up.
I’ll be watching how price reacts in that zone. A strong rejection could signal buyers stepping back in to target the highs and sweep the liquidity sitting above.
No need to rush. Let the market come into the level and prove itself first.

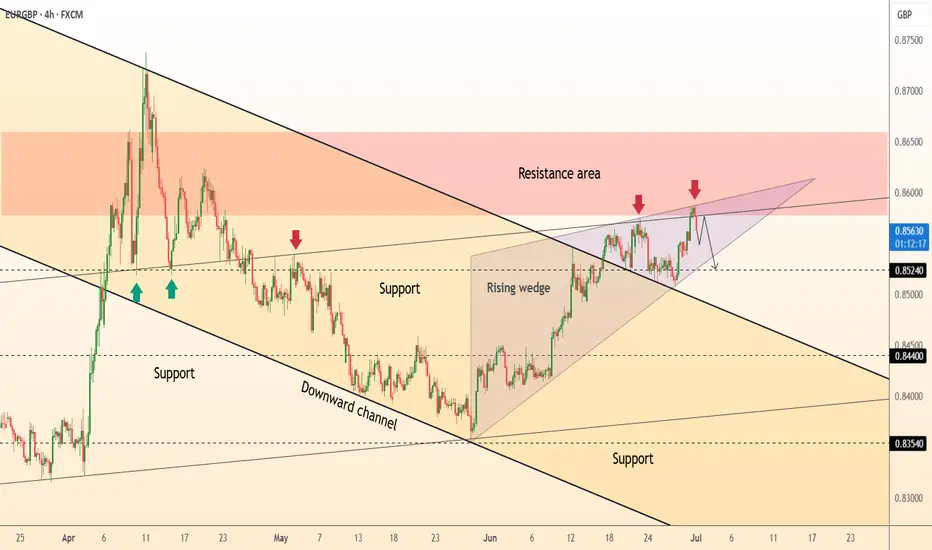
DeGRAM | EURGBP correction from the resistance area📊 Technical Analysis
● Price failed twice at 0.8580-0.8600 supply, completing a rising-wedge inside the larger downward channel; bearish divergence accompanies the second rejection.
● A clean drop back under the former breakout line (≈0.8560) turns it into fresh resistance; wedge depth and channel mid-line converge at 0.8525, with the April floor 0.8440 as next objective.
💡 Fundamental Analysis
● French election risk premium is pressuring the euro, while stronger-than-expected UK GDP proxy (ONS monthly estimate) narrows growth gap and supports sterling.
✨ Summary
Sell 0.8560-0.8570; hold below 0.8560 targets 0.8525 → 0.8440. Short view invalidated on an H4 close above 0.8600.
-------------------
Share your opinion in the comments and support the idea with like. Thanks for your support!
EURGBP: Strong Bullish Confirmation 🇪🇺🇬🇧
EURGBP is going to continue rising in an uptrend
that the pair established at the end of May.
A completion of a consolidation and a formation of a new local Higher High
indicate a highly probable bullish continuation soon.
Next resistance - 0.8605
❤️Please, support my work with like, thank you!❤️
I am part of Trade Nation's Influencer program and receive a monthly fee for using their TradingView charts in my analysis.

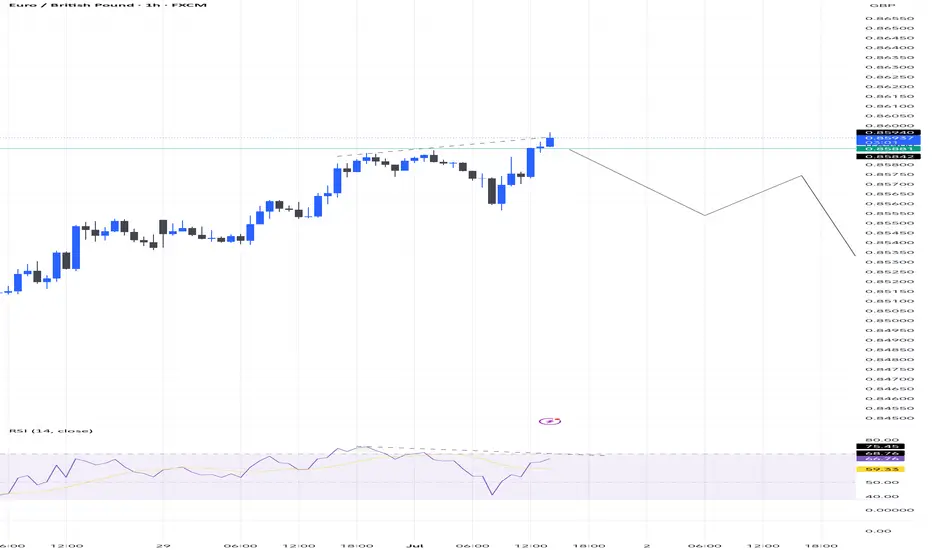
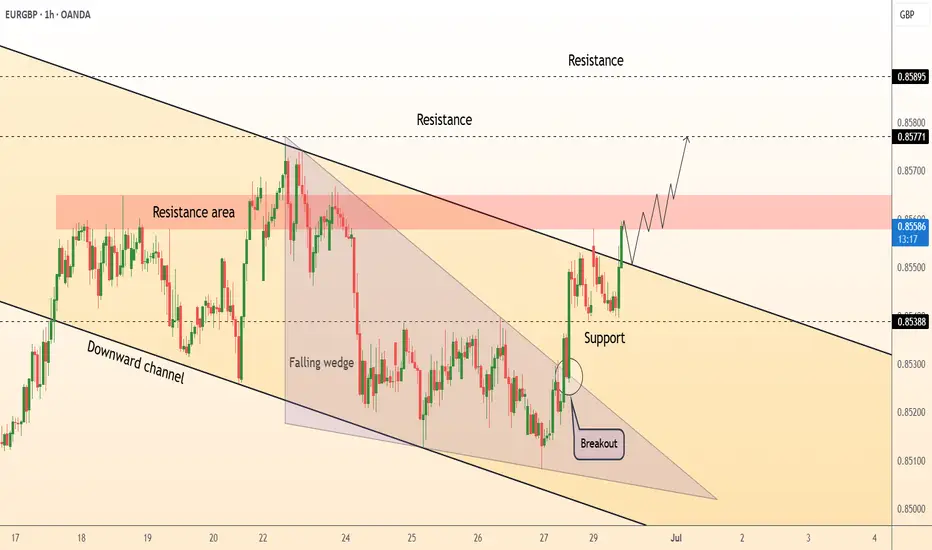
DeGRAM | EURGBP broke the channel📊 Technical Analysis
● Price broke out of a six-day falling wedge and reclaimed the channel’s upper wall at 0.8538, flipping it into support and signalling trend reversal.
● A fresh sequence of higher-lows is guiding bids toward the 0.8558-0.8565 supply; a close above that zone exposes the next resistance cluster at 0.8577 → 0.8590 (wedge 1:1 objective).
💡 Fundamental Analysis
● Softer UK GDP revisions and firmer Euro-area CPI flash (still at 2.6 % y/y) narrow rate-differential expectations, underpinning EUR vs GBP.
✨ Summary
Long 0.8538-0.8550; targets 0.8577 then 0.8590. Bull view void on an H1 close below 0.8530.
-------------------
Share your opinion in the comments and support the idea with like. Thanks for your support!
EURGBP TRADE UPDATE EURGBP seems to be doing well.
Trade can be followed and monitored individually.
Further trade updates may not be dropped

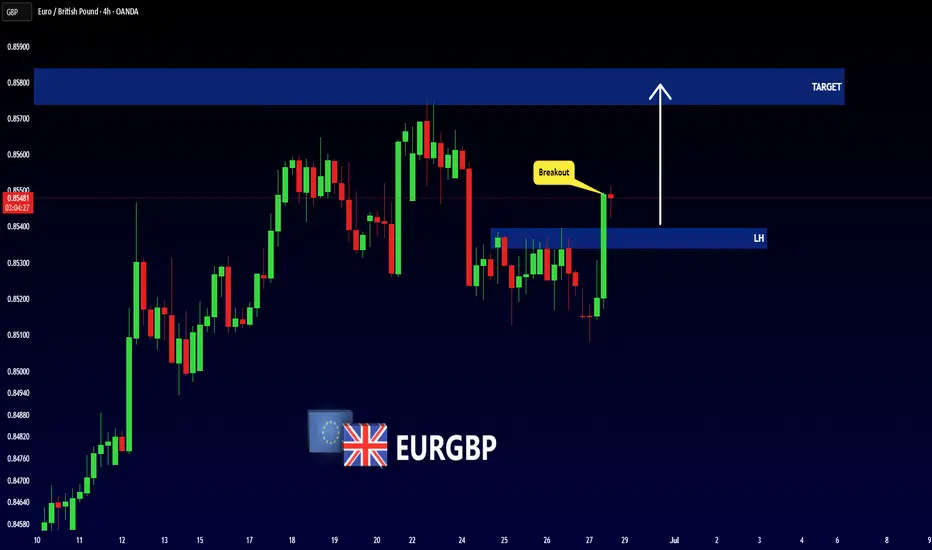
EURGBP - BULLISH MOVEHello Traders !
The EURGBP failed to create a new lower low!
The price broke the lower high (change of character).
So, I expect a bullish move🚀
______________
TARGET: 0.85740🎯