Title: Geopolitical Tempest Navigating the EUR/ILS Currency PairThe EUR/ILS exchange rate is a crucial indicator of Israel's economic and geopolitical stability in relation to the Eurozone. Recently, it has been under substantial pressure due to escalating tensions between Israel and Iran. This dynamic interplay of geopolitical risks and economic factors creates
Related currencies

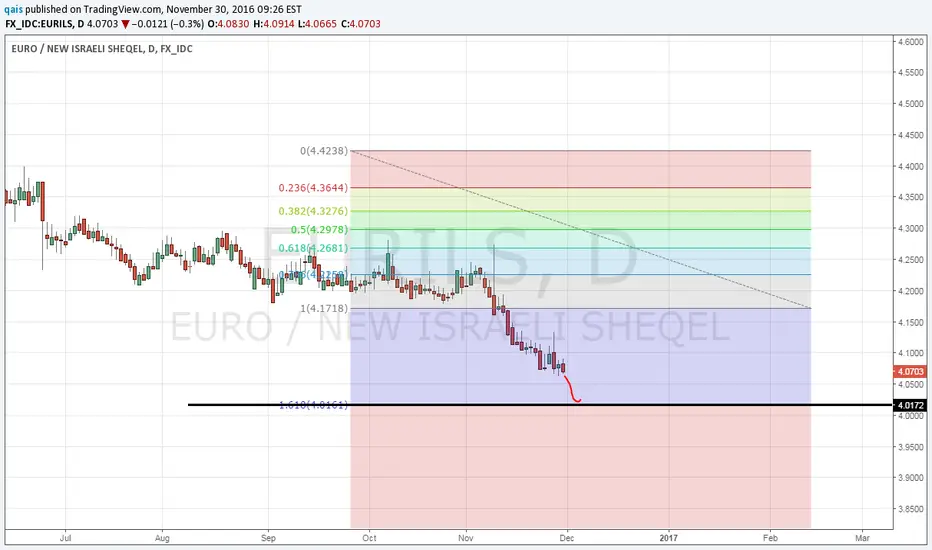
After a sharp fall, Israeli shekel begins to correct to 3.6/3.7 After a sharp fall, Israeli shekel begins to correct to 3.6/3.7 nis per euro.
Now we can see an almost ideal Wolfe wave with strong divergence as a confirmation.
Also 4 ils is a round number with a good supply zone in the past.
For my opinion very soon we will see 4 nis per euro
Have a good tr


EURO / ISRAEL moneytechnical analysis:
on monthly, bullish divergence, the retesting and retesting of a descending resistance with many fake out breakouts. the more a resistance is tested the more likely it is to break.
some fundamental analysis:
it has a miniscule inflation rate right now at 0.84% in 2021. but

EURILS Sell SignalPattern: Channel Down on 1W.
Signal: Bearish as the price made a Lower High on the 1D MA50. Confirmation of signal once the dashed line breaks.
Target: 3.700 (above -6.00% from the High).

EURILS: Sell entries.EURILS has been trading within a long term Channel Down since December 2018 (RSI = 38.590, MACD = -0.085, ADX = 31.136, Highs/Lows = -0.0915). At the moment it is trading around the 1D MA50 and on the Lower High trend line. We expect the price to be rejected back to the 3.7790 Support. If not, then

EURILS: Further downside expected.The pair is on a strong 1M Channel Down (RSI = 37.575, MACD = 0.082, Highs/Lows = -0.1355) since the beginning of the year. We are expecting another test of the 3.7870 1D Support. Based on the RSI (despite being a bullish divergence) we are expecting a symmetric low outside the Channel. That should

Made a Lower High on the 1D Channel Down. Short.EURILS has just priced a Lower High on the 1D Channel Down (RSI = 48.245, MACD = -0.010, Highs/Lows = 0.0000) and has started to reverse. We are short with TP = 4.0900.


See all ideas
Summarizing what the indicators are suggesting.
Oscillators
Neutral
SellBuy
Strong sellStrong buy
Strong sellSellNeutralBuyStrong buy
Oscillators
Neutral
SellBuy
Strong sellStrong buy
Strong sellSellNeutralBuyStrong buy
Summary
Neutral
SellBuy
Strong sellStrong buy
Strong sellSellNeutralBuyStrong buy
Summary
Neutral
SellBuy
Strong sellStrong buy
Strong sellSellNeutralBuyStrong buy
Summary
Neutral
SellBuy
Strong sellStrong buy
Strong sellSellNeutralBuyStrong buy
Moving Averages
Neutral
SellBuy
Strong sellStrong buy
Strong sellSellNeutralBuyStrong buy
Moving Averages
Neutral
SellBuy
Strong sellStrong buy
Strong sellSellNeutralBuyStrong buy
Displays a symbol's price movements over previous years to identify recurring trends.