EURJPY is rising to 173 for a bearish and larger pattern.EURJPY is rising to 173 for a bearish and larger pattern.
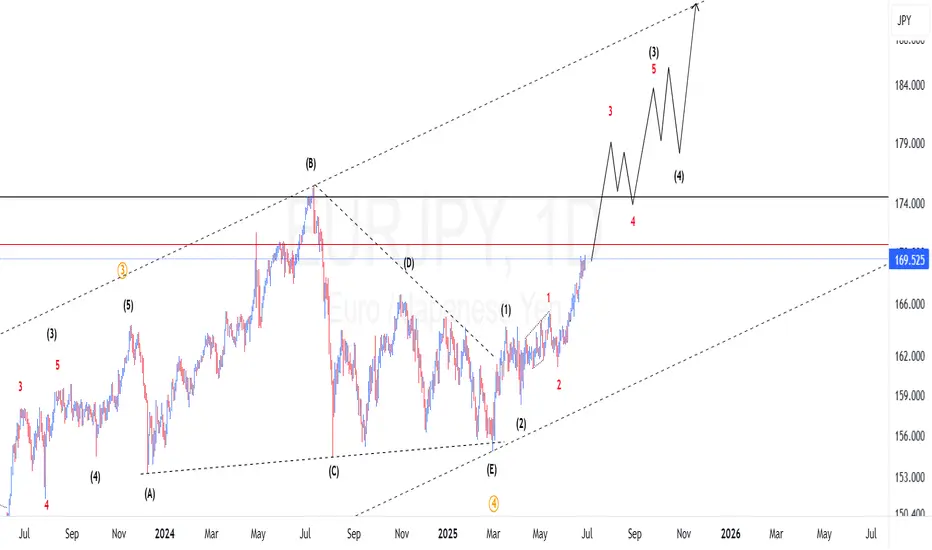
Since the beginning of March 2025, EURJPY started an uptrend and is still rising in a clear way with no signs of reversal.
As long as the BOJ has no plans to change its monetary policy statement or make any significant interventions in Forex, then EURJPY can continue to rise higher.
There is a high possibility that Eurjpy will complete a major daily harmonic pattern near 173.00.
Given that EURJPY may be close to the all-time high zone, the reversal could also occur within the zone, but I think EURJPY may start a reversal between 173.00 and the higher level. We can look for sell signals there.
At the moment, EURJPY is rising and may rise to 173.00, although not in a clear way.
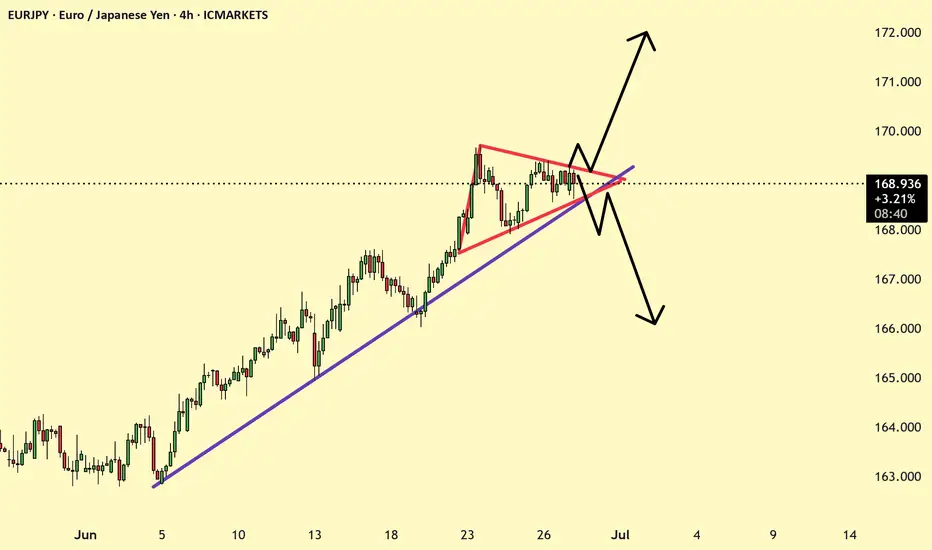
You may find more details in the chart!
Thank you and Good Luck!
PS: Please support with a like or comment if you find this analysis useful for your trading day
Disclosure: I am part of Trade Nation's Influencer program and receive a monthly fee for using their TradingView charts in my analysis.
EURJPY trade ideas

EJ WAITING GAME Price is settling at an all time high. Waiting to see what price action has n store for the next couple of days.
We are in a bullish market at this time.
A simple trade idea at this time is looking for a pullback to the monthly support before testing all time high resistance marked above in red.
Potential Bullish EURJPYI'll be looking to enter 2 trades from this area.
Trade 1 - 1:1 RR
Trade 2 - 1:3 RR
Tighten up SL if trade takes the 1:1 and makes a significant move away from the level.


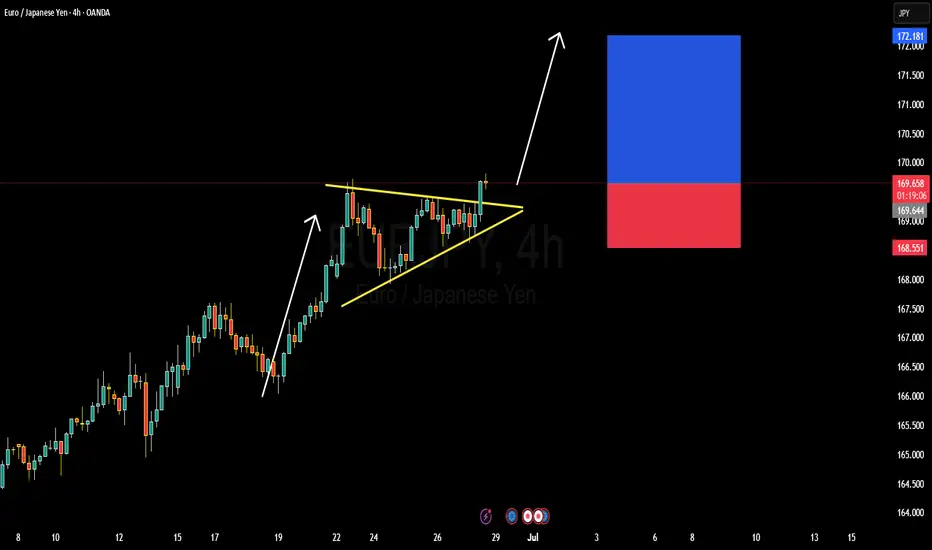
EURJPY BULLISH OR BEARISH DETAILED ANALYSISEURJPY has just broken out of a well-defined bullish pennant pattern on the 4H timeframe, confirming strong continuation potential to the upside. The price is currently hovering around 169.60 after consolidating in a tight structure, respecting both dynamic trendline support and horizontal resistance. This breakout signals renewed bullish momentum, and I'm now targeting the 172.10 zone as the next significant resistance level. The structure is clean, volume supported the breakout, and price action is aligned with the dominant uptrend.
Despite a relatively quiet start to the week—largely influenced by global risk-off sentiment surrounding Middle East tensions—EURJPY has held firm. Now that geopolitical jitters are easing slightly, yen weakness is resurfacing. The Bank of Japan remains firmly dovish, maintaining ultra-loose policy, while the Euro is supported by hawkish commentary from the ECB as inflation in the eurozone remains sticky. This divergence continues to fuel the long-term bullish bias for EURJPY.
Fundamentally, Japanese economic indicators remain soft, and there's still no clarity on when the BoJ will meaningfully shift policy. Meanwhile, EUR zone confidence indicators have stabilized, and speculation is growing around the ECB holding rates higher for longer into Q3. With widening yield differentials and a favorable risk sentiment return, this pair is positioned well for upside movement. Current momentum supports the probability of reaching the 172.00–172.10 area as risk appetite rebuilds across markets.
Technically and fundamentally aligned, EURJPY offers one of the strongest bullish continuation opportunities on the board right now. I will continue to monitor for minor dips as potential add-on areas, aiming for a full extension of the measured move from the pennant formation. Patience pays in setups like this where structure, sentiment, and macro all align.
POTENTIAL SELL OPPORTUNITY IN EURJPYPrice is set drop from the current price after we encountered a resistant around the high of 169.836 a sell opportunity is envisaged from the current market price. Target profit is at 165.999

EURJPY - Important Breakout !Hello Traders !
The EURJPY price broke the resistance level (167.520 - 168.018).
This key level becomes new support!
So, I expect a bullish move🚀
_______________
TARGET: 170.570

Multi-Timeframe Analysis & Trend Continuation TradingThe EURJPY has recently violated an important level of structure leading us to make the prediction of price continuing to go higher.
In this video we'll take a look at where the next stopping point may be and what I'm waiting for the market to do in order to get involved in the trade.
If you have any questions, comments or just want to share your views/analysis, please do so below.
Akil

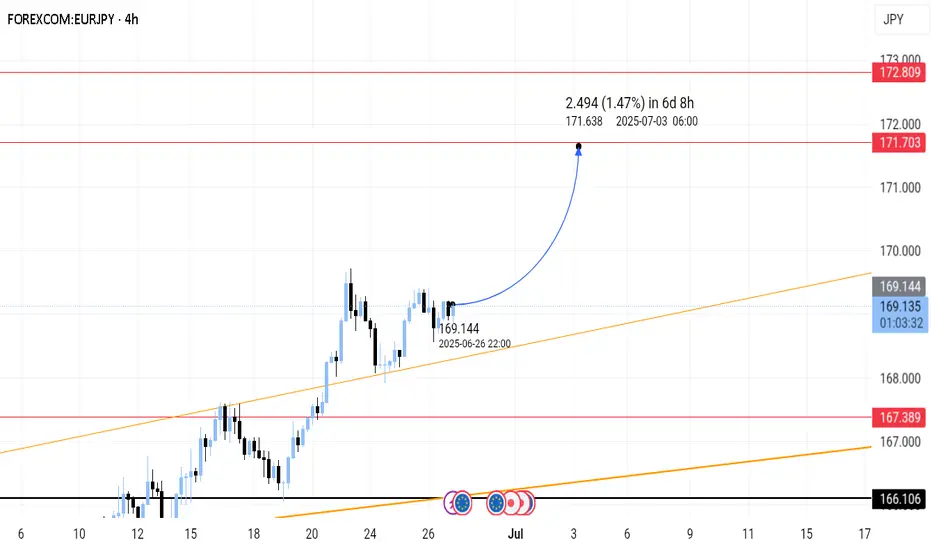
EURJPY: A Big Move In Making, Please Share Your Views! Date: 22/06/2025
Hello everyone,
I hope you’re all having a good weekend. As we previously discussed, we expected a sharp decline in Europe/JPY, but unfortunately, it didn’t work out in our favour due to the extremely bullish US dollar. This led to the crossing and invalidation of our two selling zones.
Looking at next week’s price projection, we can confirm that the price is heading towards 170.50 and may be selling at this level. Therefore, we will be keeping a stop loss at 171.50.
Once the trade is activated, we can set our target at 166.0, 163.50, and the final target will be placed at 158.50.
If you like our work, please like our idea.
Good luck and trade safely next week.

SELL EURJPY for bullish trend reversal STOP LOSS: 170.17SELL EURJPY for bullish trend reversal
STOP LOSS: 170.17
Regular Bearish Divergence
In case of Regular Bearish Divergence:
* The Indicator shows Lower Highs
* Actual Market Price shows Higher Highs
We can see a strong divergence on the MACD already and There is a strong trend reversal on the 4 hour time frame chart.....
The daily time frame is showing strength of trend reversal from this level resistance so we
are looking for the trend reversal and correction push from here .....
TAKE PROFIT : take profit will be when the trend comes to an end, feel from to send me a direct DM if you have any question about take profit or anything
Remember to risk only what you are comfortable with….....trading with the trend, patient and good risk management is the key to success here

EURJPYThis is within upmove trend on D tf.
Possibly its correction of the upmove beginning on lower tf
The view is price to touch either XX or YY levels
Use Stop loss

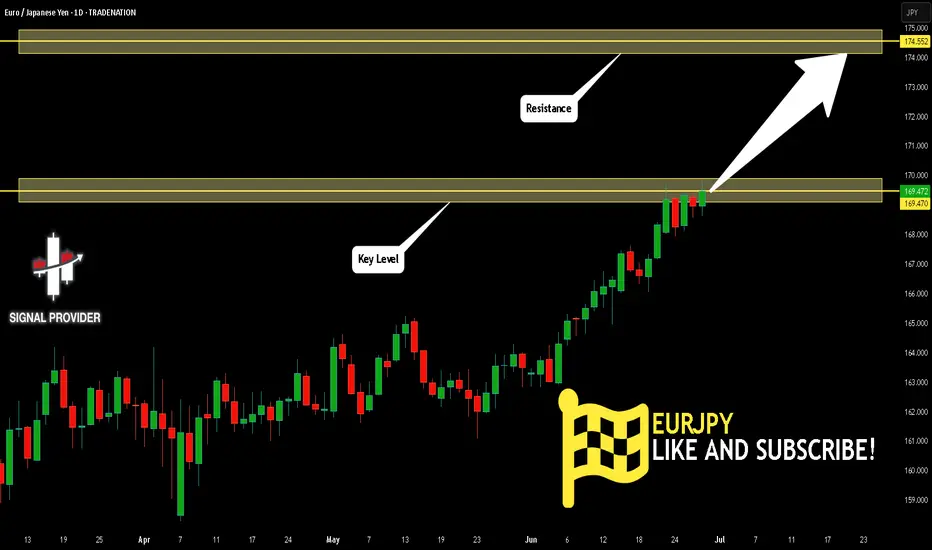
EURJPY Is Very Bullish! Long!
Take a look at our analysis for EURJPY.
Time Frame: 1D
Current Trend: Bullish
Sentiment: Oversold (based on 7-period RSI)
Forecast: Bullish
The market is on a crucial zone of demand 169.470.
The oversold market condition in a combination with key structure gives us a relatively strong bullish signal with goal 174.552 level.
P.S
Please, note that an oversold/overbought condition can last for a long time, and therefore being oversold/overbought doesn't mean a price rally will come soon, or at all.
Disclosure: I am part of Trade Nation's Influencer program and receive a monthly fee for using their TradingView charts in my analysis.
Like and subscribe and comment my ideas if you enjoy them!
EURJPY bullish continuation Price is still on uptrend on 3rd wave wave. What we should expect is small pullbacks and continuation up.
EURJPY - Over-Bought Big Time!Hello TradingView Family / Fellow Traders. This is Richard, also known as theSignalyst.
📈EURJPY has been overall bullish trading within the rising channel marked in blue. However, it is currently retesting the upper bound of the channel.
Moreover, the green zone is a major weekly supply.
🏹 Thus, the highlighted red circle is a strong area to look for sell setups as it is the intersection of the upper blue trendline and weekly supply.
📚 As per my trading style:
As #EURJPY approaches the red circle zone, I will be looking for bearish reversal setups (like a double top pattern, trendline break , and so on...)
📚 Always follow your trading plan regarding entry, risk management, and trade management.
Good luck!
All Strategies Are Good; If Managed Properly!
~Rich
Disclosure: I am part of Trade Nation's Influencer program and receive a monthly fee for using their TradingView charts in my analysis.

EURJPY Follow Ascending channel bullish possible from support📈 EURJPY Technical Outlook – 4H Timeframe
EURJPY continues to respect the ascending channel, showing bullish momentum from the 168.100 support level.
🎯 Technical Targets:
1st Target: 169.700 – Key Supply Zone
2nd Target: 170.800 – Next Major Resistance
As long as price holds above 168.100, buyers remain in control.
🚨 Watch for potential reactions near these supply zones.
✨ Like, follow, comment, and join us for more premium updates and trade ideas!
— Livia 😜

EURJPY possible ScenarioEURRJPY in upward trend currently formed a triangle a breakout may lead it to up and a breakdown of trendline to downward.
EURJPY : m30 (Short Position)By analyzing the 30-minute time frame and observing liquidity at the lows, I have a bearish scenario from 169.10 down to 168.20

EURJPY MASSIVE RISE for the next few weeks. BUY below 170EURJPY has seen some rosy seasons the past 5 years. Every year it keeps grinding up to reach new highs, from 115 in 2020 to reach a parabolic high last year at 175 on June 2024.
Then, as with any parabolic era, hibernation comes after that peak tap at 175 that lasted 9 months. Price has woken up this year starting on April -- then charging up more this month. This consistent weekly gains is hinting of a bigger shift that only comes every 1-2 years.
From our diagram above you can observe the last big ascend from its big shifts. This shifts resurfaced every 1-2 years. And this quarter 2 we got another rare change in structure conveying a weighty rise ahead in the next 12 months moving forward.
EURJPY corrected heavily back to 1.0 FIB LEVELS, the most discounted bargain zone you can imagine -- so buyers converging on this area is a no brainer.
STRONG BUY at this levels -- below 170 is a definite bargain.
The price growth from the last few weeks is a testament of the directional context EJ is about to undertake.
Expect some greener seasons on this pair as it moves forward.
Harvest will be generous.
Spotted at 168.0
Interim target at 171
Mid/Long term target at 200.
TRADE SAFELY always. Market is Market.
Not financial advice. TAYOR.

EURJPY Sell- Go for sell
- Refine entry with smaller SL for better RR, if you know how
- keep looking for sell even if price goes one more up
A Message To Traders:
I’ll be sharing high-quality trade setups for a period time. No bullshit, no fluff, no complicated nonsense — just real, actionable forecast the algorithm is executing. If you’re struggling with trading and desperate for better results, follow my posts closely.
Check out my previously posted setups and forecasts — you’ll be amazed by the high accuracy of the results.
"I Found the Code. I Trust the Algo. Believe Me, That’s It."

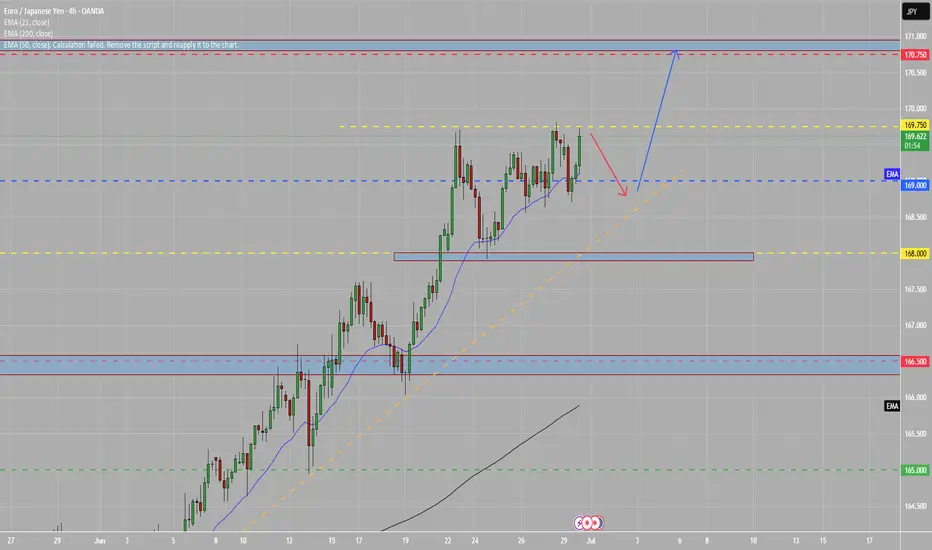
Eur/Jpy breaks the previous🔍 Key Observations:
Supply Zone (169.713):
Price is approaching a marked supply zone, where sellers previously stepped in with strong momentum. This zone could act as a resistance area, potentially rejecting price downward.
Previous Low Break:
The structure shows that price broke below a previous low, indicating bearish pressure and a possible shift in market sentiment.
Demand Zone Below (~168.700):
There's a strong demand zone marked below the current price, which may serve as a target for short sellers or an area for bullish entries if reached.
Projected Move (Orange Arrows):
The orange path suggests a potential move:
Price may first retest the supply zone around 169.713.
A rejection from that level could trigger a downward move, breaking recent support levels.
The price may bounce slightly midway before continuing the drop toward the demand zone.
RSI Indicator (Relative Strength Index):
Currently at 54.80 (blue line), the RSI is nearing overbought territory but not yet extreme. This leaves room for a bit more upside before a potential reversal, aligning with the idea of testing the supply zone first.

EURJPY - Looking To Sell Pullbacks In The Short TermM15 - Strong bearish move.
Lower lows on the moving averages of the MACD.
No opposite signs.
Currently it looks like a pullback is happening.
Expecting bearish continuation until the two Fibonacci resistance zones hold.
If you enjoy this idea, don’t forget to LIKE 👍, FOLLOW ✅, SHARE 🙌, and COMMENT ✍! Drop your thoughts and charts below to keep the discussion going. Your support helps keep this content free and reach more people! 🚀
--------------------------------------------------------------------------------------------------------------------

EURJPYAs our followers may remember, we already secured a great profit on EURJPY.
Now, we're once again waiting for price to revisit our key level — so we can potentially catch another high-probability setup.
📌 Always remember:
The market is unpredictable.
We're not here to predict — we're here to react, using technical analysis, clear setups, proper risk and trade management.
❌ If a level breaks, we don’t panic.
✅ Instead, we patiently wait for a pullback and take advantage of the next smart entry.
