EURJPY: Another Bullish pattern pushing EURJPY to 173 EURJPY: Another Bullish pattern pushing EURJPY to 173
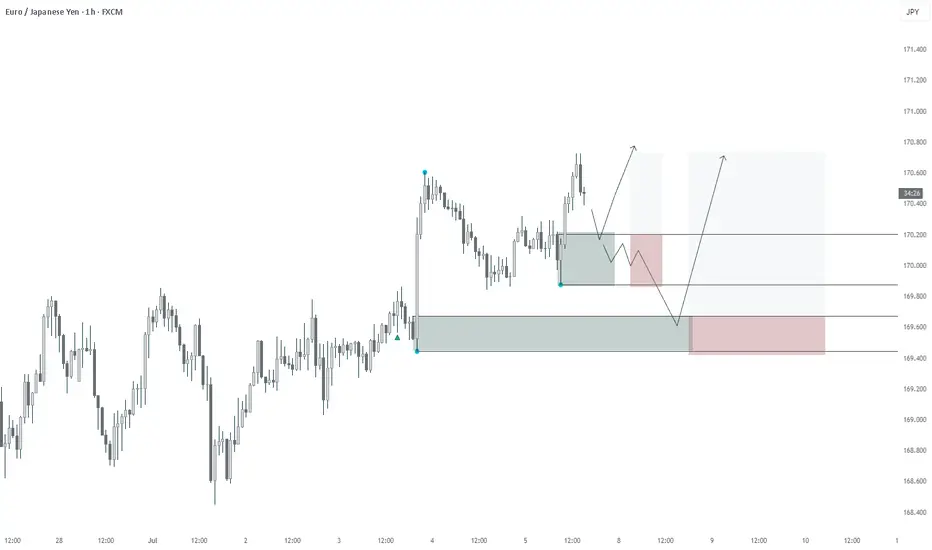
Yesterday, EURJPY confirmed a bullish triangle pattern during the opening of the U.S. market.
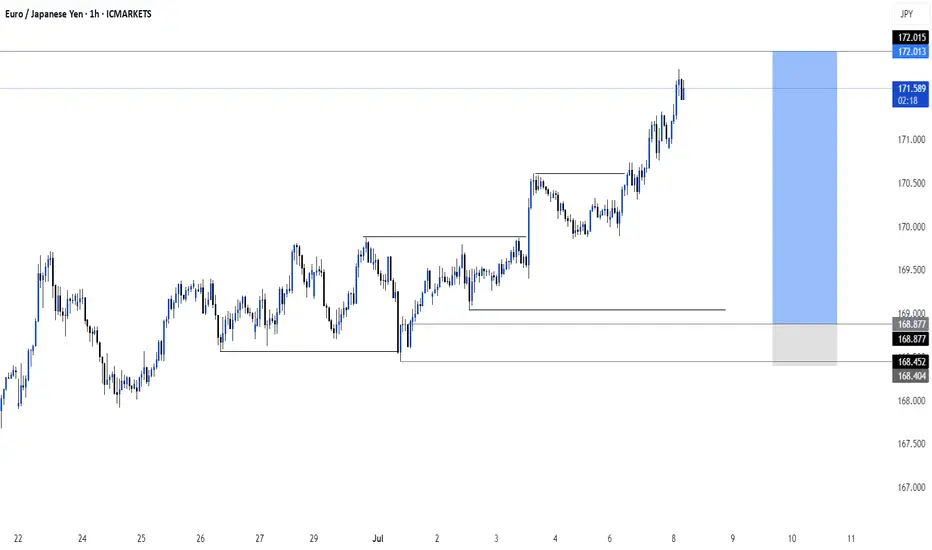
EURJPY has already reached 170.60 and is coming back for a retest of the broken resistance before moving higher again.
It's a complex situation, but if the price holds above the 169.75 pattern, the chances of a clear uptrend will increase further.
Remember that the larger pattern will be almost complete near 173.00.
You may find more details in the chart!
Thank you and Good Luck!
PS: Please support with a like or comment if you find this analysis useful for your trading day
Disclosure: I am part of Trade Nation's Influencer program and receive a monthly fee for using their TradingView charts in my analysis.
EURJPY trade ideas

EURJPY Will Go Lower! Sell!
Please, check our technical outlook for EURJPY.
Time Frame: 9h
Current Trend: Bearish
Sentiment: Overbought (based on 7-period RSI)
Forecast: Bearish
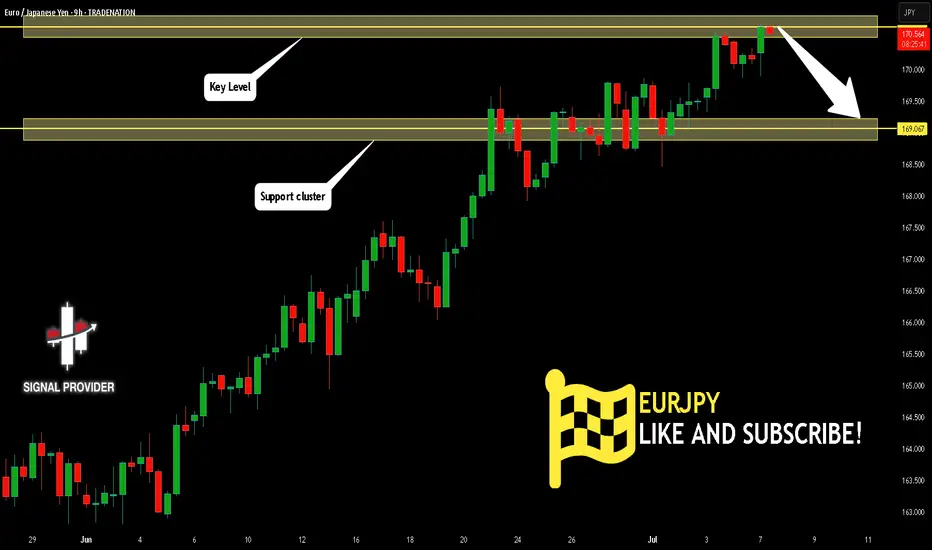
The price is testing a key resistance 170.636.
Taking into consideration the current market trend & overbought RSI, chances will be high to see a bearish movement to the downside at least to 169.067 level.
P.S
We determine oversold/overbought condition with RSI indicator.
When it drops below 30 - the market is considered to be oversold.
When it bounces above 70 - the market is considered to be overbought.
Disclosure: I am part of Trade Nation's Influencer program and receive a monthly fee for using their TradingView charts in my analysis.
Like and subscribe and comment my ideas if you enjoy them!
EURJPY Bullish Breakout!
HI,Traders !
#EURJPY is trading in an
Uptrend an the pair made a
Bullish breakout of the key
Horizontal level of 169.790
Which is confirmed so after
pullback we will
Be expecting a further
Bullish continuation !
Comment and subscribe to help us grow !

EURJPY is rising to 173 for a bearish and larger pattern.EURJPY is rising to 173 for a bearish and larger pattern.
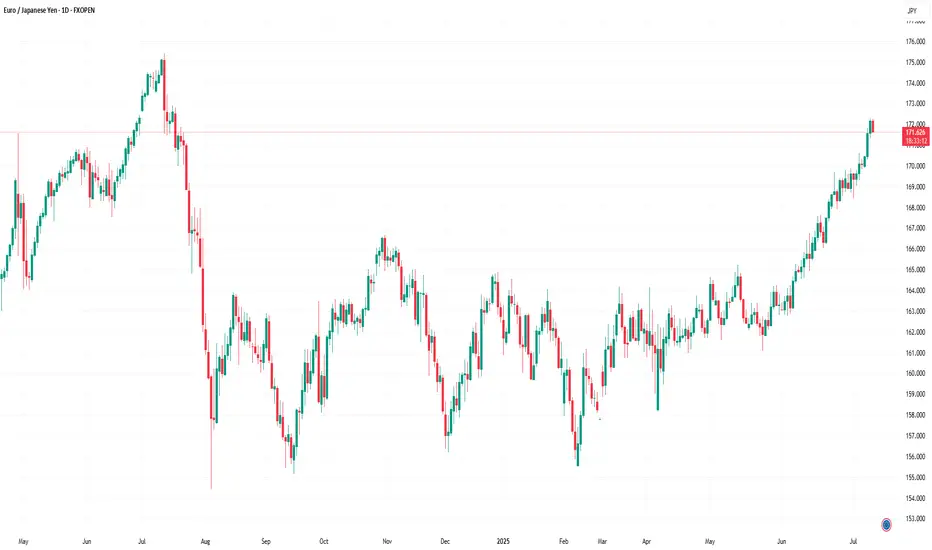
Since the beginning of March 2025, EURJPY started an uptrend and is still rising in a clear way with no signs of reversal.
As long as the BOJ has no plans to change its monetary policy statement or make any significant interventions in Forex, then EURJPY can continue to rise higher.
There is a high possibility that Eurjpy will complete a major daily harmonic pattern near 173.00.
Given that EURJPY may be close to the all-time high zone, the reversal could also occur within the zone, but I think EURJPY may start a reversal between 173.00 and the higher level. We can look for sell signals there.
At the moment, EURJPY is rising and may rise to 173.00, although not in a clear way.
You may find more details in the chart!
Thank you and Good Luck!
PS: Please support with a like or comment if you find this analysis useful for your trading day
Disclosure: I am part of Trade Nation's Influencer program and receive a monthly fee for using their TradingView charts in my analysis.

EUR/JPY Hits 12-Month HighEUR/JPY Hits 12-Month High
As the chart indicates, the EUR/JPY pair has risen above ¥172 per euro — a level last seen in July 2024.
Since early June, the exchange rate has increased by approximately 5.6%. This upward movement is driven by a combination of factors, including:
→ Divergence in central bank policy: The European Central Bank’s key interest rate remains significantly higher than that of the Bank of Japan, making the euro more attractive in terms of yield compared to the yen.
→ US trade tariffs on Japan: The potential imposition of 25% tariffs by the United States on Japanese goods poses a threat to Japan’s export-driven economy, placing downward pressure on the national currency.
→ Eurozone expansion and consolidation: News of Bulgaria’s potential accession to the euro area is strengthening investor confidence in the single currency.
→ Weakness in the US dollar: As the US Dollar Index fell to its lowest level since early 2022 this July, demand for the euro has grown, positioning it as a key alternative reserve currency.
Can the rally continue?
Technical Analysis of EUR/JPY
For several months, the pair traded within a range of approximately ¥156–165 per euro, but has recently broken above the upper boundary of this channel. Based on technical analysis, the width of the previous range implies a potential price target in the region of ¥174 per euro.
It is noteworthy that the rally gained momentum (as indicated by the arrow) following the breakout above the psychological threshold of 170, a sign of bullish market dominance. At the same time, the RSI has surged to a multi-month high, signalling moderate overbought conditions.
Under these circumstances, the market may be vulnerable to a short-term correction, potentially:
→ Towards the lower boundary of the ascending channel (shown in orange);
→ To retest the psychological support around ¥170.
That said, a reversal of the prevailing trend would likely require a significant shift in the fundamental backdrop — for example, progress towards a trade agreement between Japan and the United States.
This article represents the opinion of the Companies operating under the FXOpen brand only. It is not to be construed as an offer, solicitation, or recommendation with respect to products and services provided by the Companies operating under the FXOpen brand, nor is it to be considered financial advice.
EURJPY - NEW BREAKOUT !Hello Traders !
After a huge bullish move,
The EURJPY broke the resistance level (170.639 - 171.605).
This key level becomes new support!
So, I expect a new bullish move🚀
_____________
TARGET: 173.530🎯

EURJPY – Buy the Dip in a Continuing UptrendTrade Idea
Type: Buy Limit
Entry: 171.00
Target: 172.50
Stop Loss: 170.25
Duration: Intraday
Expires: 11/07/2025 06:00
Technical Overview
The primary trend remains bullish, with no clear signs that the upward move is ending.
While a correction is possible, it is expected to be contained within the broader uptrend, providing an opportunity to buy at lower levels.
A move above 172.00 will confirm renewed bullish momentum, supporting a move toward 172.50, with a measured move target at 172.75.
Current levels do not offer a good risk/reward for immediate buying, so waiting for a dip to 171.00 is preferred.
No significant economic events are scheduled in the next 24 hours, keeping the focus on technical factors.
Key Technical Levels
Support: 172.00 / 171.50 / 171.00
Resistance: 172.00 / 172.50 / 172.75
Disclosure: I am part of Trade Nation's Influencer program and receive a monthly fee for using their TradingView charts in my analysis.

EURJPY Potential Sell ZoneI've set 2 pending limit orders here. One for the 1:1 RR and the other for a 1:4.3 RR. If the first trade holds we get a free shot at the 1:4 RR. NFA. Manage your risk accordingly. Sometimes I'll move to BE on trade 2 once we clear 1:2 RR.

EURJPY: Clean Rejection Off the 200 EMAPrice tapped the 200 EMA and held.
Structure still bullish, no reason to flip bias just yet.
Let’s see if buyers can take it from here — nothing forced, just flow.

Potential Short Opportunity on EURJPYReasons I think this pair will fall:
- Confirmed Trend line means harder break out.
- RSI was overbought on the 4H time frame
- Potential double top
What do you think?

ABCHello traders! Happy Friday — hope you're closing the week strong.
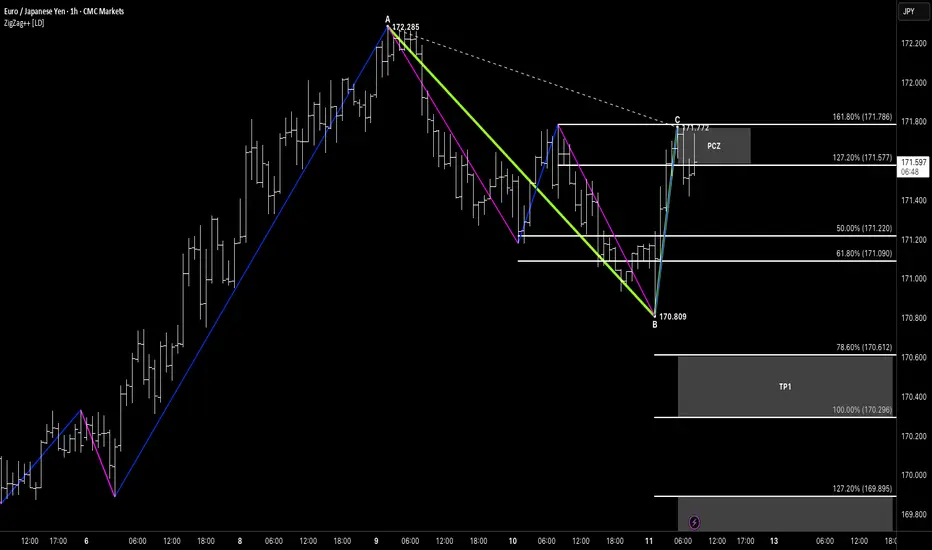
Let’s break down this clean ABC Bearish pattern on EURJPY from the 1H chart.
📍 Structure Breakdown
We’re looking at a sharp A to B decline followed by a corrective rally into point C.
Point C completes just under the previous swing high, creating a potential lower high setup.
Price has reacted from this level and is now pushing lower, confirming bearish momentum.
🎯 Target Zones
We’ve projected the AB leg from point C to define a measured move:
TP1: 170.29 (100%)
TP2: 169.89 (127.2%)
Final extension at 169.38 (161.8%) offers additional confluence
Note how the TP1 zone aligns with prior structure levels and the 78.6% extension — offering a clean reaction area.
🧠 Pattern Notes
ABC symmetry-based projection
Bearish impulse > corrective rally structure
Potential for deeper extension if TP1 breaks
Beautiful example of structure-followed geometry
EURJPY SHORT DAILY FORECAST Q3 D11 W28 Y25EURJPY SHORT DAILY FORECAST Q3 D11 W28 Y25
It’s Fun Coupon Friday! 💸🔥
Professional Risk Managers👋
Welcome back to another FRGNT chart update📈
Diving into some Forex setups using predominantly higher time frame order blocks alongside confirmation breaks of structure.
Let’s see what price action is telling us today! 👀
💡Here are some trade confluences📝
✅Daily Order block identified
✅4H Order Block identified
✅1H Order Block identified
🔑 Remember, to participate in trading comes always with a degree of risk, therefore as professional risk managers it remains vital that we stick to our risk management plan as well as our trading strategies.
📈The rest, we leave to the balance of probabilities.
💡Fail to plan. Plan to fail.
🏆It has always been that simple.
❤️Good luck with your trading journey, I shall see you at the very top.
🎯Trade consistent, FRGNT X

eurjpy buy setup Setup Breakdown:
1. Previous Downtrend and Market Structure Shift (MSS):
Price was in a clear downtrend, as seen on the left side.
A Market Structure Shift (MSS) is marked — this suggests the beginning of a potential bullish reversal.
After MSS, price makes a higher high and pulls back, indicating bullish interest.
2. Liquidity Grab Below Previous Day’s Low (PDL):
Price swept below the Previous Day's Low (PDL) and into a demand zone (blue and purple shaded box).
This is a classic liquidity hunt — smart money clears out stop losses below the PDL before reversing.
3. Refined Demand Zone (Entry):
Entry is planned at the refined demand zone, where price previously showed buying interest.
The entry (pink box) is within this zone, suggesting you’re anticipating a reaction there.
4. FVG (Fair Value Gap) Fill and Targeting Supply:
The target zone is marked in the grey box at the top, just below 172.221, likely a previous supply area or unmitigated order block.
The grey shaded area is a high reward zone, showing you expect a strong bullish move from demand into that supply.
5. Risk-to-Reward:
Stop loss just below the demand zone, likely under the liquidity sweep.
Take profit is around 2–3x the stop distance, targeting the premium/supply area.
✅ Why This is a Strong Buy Setup:
MSS confirmed (shift from bearish to bullish structure).
PDL sweep = liquidity grab → fuels bullish move.
Entry in refined demand aligned with price action logic.
Clear imbalanced area above → price may seek to fill inefficiencies.
High Risk-Reward with low drawdown potential if demand holds


EUR/JPY: Healthy Correction Expected Before the Next Leg UpWelcome back! Let me know your thoughts in the comments!
** EURJPY Analysis !
We recommend that you keep this pair on your watchlist and enter when the entry criteria of your strategy is met.
Please support this idea with a LIKE and COMMENT if you find it useful and Click "Follow" on our profile if you'd like these trade ideas delivered straight to your email in the future.
Thanks for your continued support! Welcome back! Let me know your thoughts in the comments!

EURJPY: Bullish Outlook Explained 🇪🇺🇯🇵
There is a high chance that EURJPY will continue rising
from an underlined horizontal support.
I see 2 strong price action confirmations:
the price violated a resistance line of a bullish flag
and a neckline of a double bottom pattern.
Goal - 170.4
❤️Please, support my work with like, thank you!❤️
I am part of Trade Nation's Influencer program and receive a monthly fee for using their TradingView charts in my analysis.


EURJPYon the 5m timeframe, Price has reached a Short/Long Term true average. Also the overall market P.O.C its ranging in the lower timeframe supply wicks
EURJPY TRADE SETUPMarket trend is up also broken this recent ranging zone and retested so i hope this week price is continue to up so let's see what happenned guys

EURJPY Hits Supply | Pullback Is ComingPrice has entered the daily supply zone (red area) between 170.80 and 171.80, showing immediate rejection with a long upper wick — a signal of potential short-term bearish reaction.
The RSI is turning lower, indicating loss of momentum, although it hasn’t reached extreme levels yet.
The current map suggests a technical pullback toward the 169.40–168.50 zone (FVG + dynamic support) before any potential bullish continuation toward 174+.
The overall structure remains bullish, but a correction looks likely due to technical exhaustion and retail positioning.
📊 2. COT Report (JPY Futures – as of 2025-07-01)
Non-Commercials (speculators) reduced long positions on the JPY by -7,779 contracts, and also slightly trimmed shorts → clear sign of position reduction.
Net positioning remains strongly negative (JPY weakness), but it's starting to recover slightly.
Commercials added both longs (+2,830) and shorts (+5,977), indicating indecision but growing interest.
Open interest slightly decreased (–516), though it remains elevated.
👉 The market has not yet reversed, but the JPY downtrend may be approaching exhaustion.
🧠 3. Retail Sentiment
86% of retail traders are short EUR/JPY — a strong contrarian bullish signal.
Average retail short entry: 166.27, while current price is 171.55 → retail traders are trapped and under pressure.
A short squeeze is likely underway or already completed, increasing the risk of a technical correction after distribution.
📅 4. Seasonality
July is historically weak for EUR/JPY:
20Y: -0.35
15Y: -0.49
10Y: -0.18
August tends to be even worse from a seasonal perspective.
This supports the idea of a potential pullback in the coming days or weeks.
Trading Conclusion
Current Bias: Short-term Neutral–Bearish, Medium-term Bullish.
✳️ Potential pullback from 172.30 toward 169.40–168.50
🎯 If price holds and builds clean bullish structure, expect continuation toward 174.00–175.00
❌ Invalidation on daily close below 167.80

EURJPY SHORT – WEEKLY FORECAST Q3 | W29 | Y25💼 EURJPY SHORT – WEEKLY FORECAST
Q3 | W29 | Y25
📊 MARKET STRUCTURE SNAPSHOT
EURJPY is currently reacting from a key higher time frame supply zone, with price action showing weakness at premium levels. Structure and momentum are now aligning for a short opportunity backed by multi-timeframe confluence.
🔍 Confluences to Watch 📝
✅ Daily Order Block (OB)
Strong reaction and early signs of distribution.
Previous bullish momentum is losing steam; structure is flattening with rejection wicks forming.
✅ 4H Order Block
Break of internal structure (iBoS) confirms a short-term bearish transition.
✅ 1H Order Block
1H structure shift bearish
📈 Risk Management Protocols
🔑 Core principles:
Max 1% risk per trade
Only execute at pre-identified levels
Use alerts, not emotion
Stick to your RR plan — minimum 1:2
🧠 You’re not paid for how many trades you take, you’re paid for how well you manage risk.
🧠 Weekly FRGNT Insight
"Trade what the market gives, not what your ego wants."
Stay mechanical. Stay focused. Let the probabilities work.
🏁 Final Thoughts from FRGNT
📌 The structure is clear.
The confluences are stacked.
Let execution follow discipline, not emotion.
