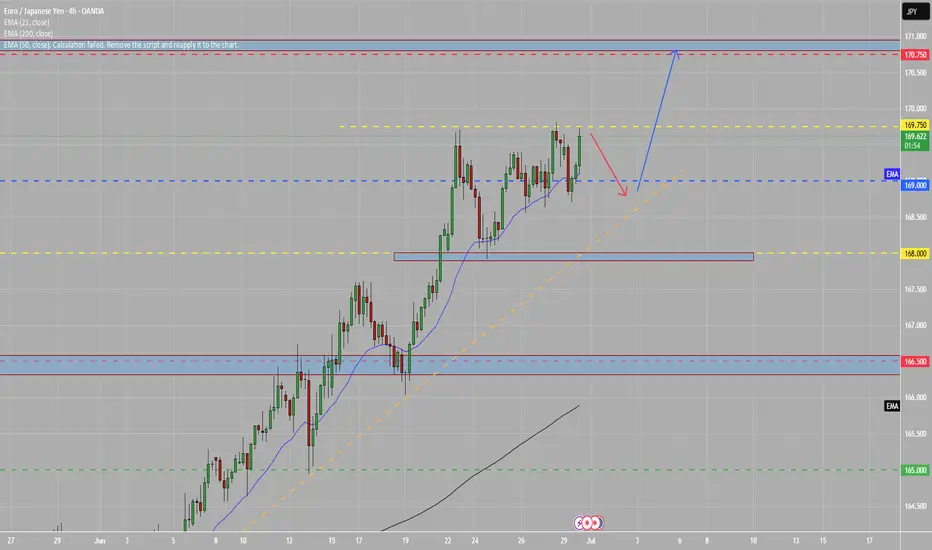
EURJPY Sell- Go for sell
- Refine entry with smaller SL for better RR, if you know how
- keep looking for sell even if price goes one more up
A Message To Traders:
I’ll be sharing high-quality trade setups for a period time. No bullshit, no fluff, no complicated nonsense — just real, actionable forecast the algorithm is executing. If you’re struggling with trading and desperate for better results, follow my posts closely.
Check out my previously posted setups and forecasts — you’ll be amazed by the high accuracy of the results.
"I Found the Code. I Trust the Algo. Believe Me, That’s It."
EURJPY trade ideas


EUR/JPY Potential Bullish ContinuationEUR/JPY Potential Bullish Continuation 📈🔍
📊 Technical Overview:
The EUR/JPY chart presents a bullish channel structure, indicating an overall upward trend. Price action respected the channel boundaries with multiple confirmations before the latest bearish correction.
🔹 Structure Highlights:
🔵 Ascending Channel: Price moved steadily within an upward-sloping channel.
🟠 Support Rebound: A strong bullish candle formed on June 20th after touching the lower boundary — a clear support confirmation.
🔴 Recent Rejection: On July 1st, price tested the upper channel resistance and faced rejection, forming a bearish engulfing candle.
🟫 Support Zone Marked: Around the 167.800 level, this zone has been tested multiple times, indicating a possible demand area.
🔁 Current Scenario:
The pair has broken down from the internal trendline (light brown line) and is heading toward the support zone. A bullish bounce from this area may lead to a rally toward the Target Point at ~172.000 🎯.
📌 Key Levels:
Support Zone: 167.600 – 168.000
Resistance Zone: 170.500 – 172.000
Current Price: 168.994
📈 Outlook:
If support holds and bullish momentum returns, there's potential for a move toward the target area at the top of the channel. However, a break below the support zone could invalidate the bullish scenario and suggest a deeper correction.
🧠 Conclusion:
Wait for bullish confirmation near support before considering long positions. A clean break and retest of the support zone could signal a continuation of the upward trend.


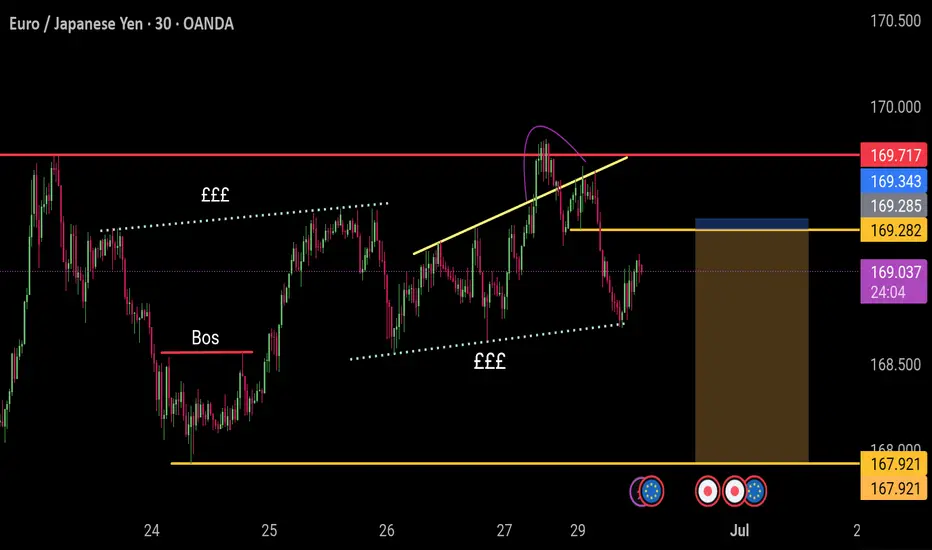
EURJPY - Looking To Sell Pullbacks In The Short TermM15 - Strong bearish move.
Lower lows on the moving averages of the MACD.
No opposite signs.
Currently it looks like a pullback is happening.
Expecting bearish continuation until the two Fibonacci resistance zones hold.
If you enjoy this idea, don’t forget to LIKE 👍, FOLLOW ✅, SHARE 🙌, and COMMENT ✍! Drop your thoughts and charts below to keep the discussion going. Your support helps keep this content free and reach more people! 🚀
--------------------------------------------------------------------------------------------------------------------

EURJPY SHORT DAILY FORECAST Q3 D1 W27 Y25EURJPY SHORT DAILY FORECAST Q3 D1 W27 Y25
Professional Risk Managers👋
Welcome back to another FRGNT chart update📈
Diving into some Forex setups using predominantly higher time frame order blocks alongside confirmation breaks of structure.
Let’s see what price action is telling us today! 👀
💡Here are some trade confluences📝
✅Daily Order block identified
✅4H Order Block identified
✅1H Order Block identified
🔑 Remember, to participate in trading comes always with a degree of risk, therefore as professional risk managers it remains vital that we stick to our risk management plan as well as our trading strategies.
📈The rest, we leave to the balance of probabilities.
💡Fail to plan. Plan to fail.
🏆It has always been that simple.
❤️Good luck with your trading journey, I shall see you at the very top.
🎯Trade consistent, FRGNT X

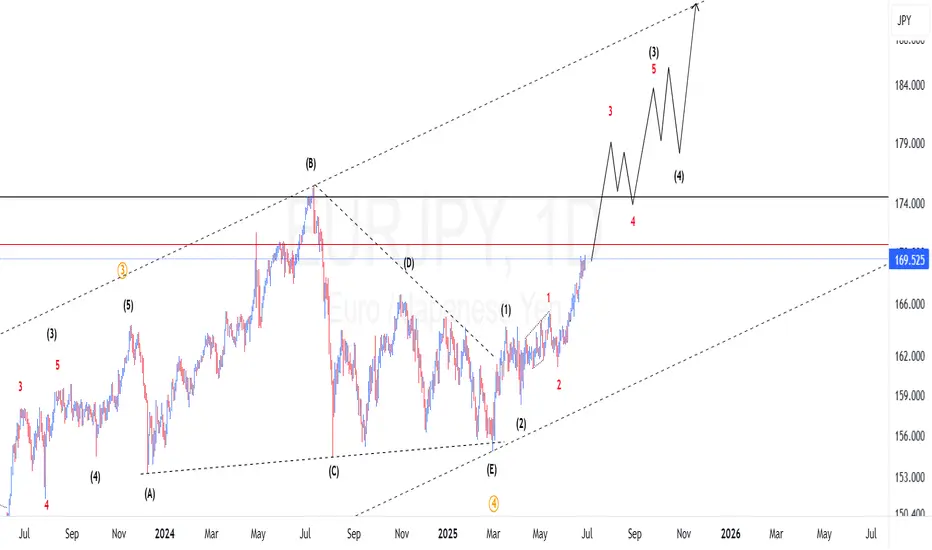
EURJPYThis is within upmove trend on D tf.
Possibly its correction of the upmove beginning on lower tf
The view is price to touch either XX or YY levels
Use Stop loss

EURJPY Bearish momentum 4hr and daily chart analaysis EUR/JPY is currently entering a bearish phase, trading around a critical transition zone between 171.00 and 169.787. This area marks a key inflection point, and a clear break below could confirm the shift in momentum to the downside. If the bearish momentum continues to build, the pair could potentially decline further, targeting the support levels around 158.253 to 156.843.

EURJPY Readies Triangle Breakout w/ Elliot WaveOANDA:EURJPY has formed a Triangle Pattern with a Rising Support and Resistance Zone @ 169.5 - 169.7 area.
After the False Breakout last week on Friday, we see Price falls back within the Pattern and finds strong Resistance from the zone.
Now based from the High - to Low - to Lower High where price made a 50% - 61.8% Retracement, we can plot the Trend Based-Fib Tool that suggests with the change of trend ( Price printing a Lower High ) we can expect Lower Prices to come and potentially a Bearish Breakout to the pattern!
First we will want to see where the next Lower Low will be ( currently @ 168.934 ) then wait for a Retracement to a favorable Fibonacci Level based from the Lower High to Lower Low.
Fundamentally, the EUR will have CPI Flash Estimates on Tuesday, and multiple Services PMI on Thursday with ECB President Lagarde speaking Tuesday and Wednesday. This could add volatility!!
Stay Tuned!

EJ WAITING GAME Price is settling at an all time high. Waiting to see what price action has n store for the next couple of days.
We are in a bullish market at this time.
A simple trade idea at this time is looking for a pullback to the monthly support before testing all time high resistance marked above in red.
EURJPY can we see one more bullish?
OANDA:EURJPY long time we having bullish push, currently price on sup zone, from which expecting one more bullish.
SUP zone: 168.800
RES zone: 170.800, 171.200

EUR/JPY 1H Analysis – Ascending Channel With Critical ResistanceThe EUR/JPY pair has been trending steadily inside a well-defined ascending channel, indicating bullish control over the past few weeks. However, price is now approaching a major horizontal resistance zone, aligning with the upper boundary of the channel — a critical area for potential breakout or reversal.
🔍 Chart Structure Breakdown:
🔹 1. Ascending Channel (Trend Continuation Structure)
The pair is respecting both the upper and lower trendlines precisely, forming a bullish parallel channel.
EMAs are aligned bullishly and acting as dynamic support.
Price continues forming higher highs and higher lows, a classic uptrend behavior.
🔹 2. Horizontal Resistance Zone (Purple Box)
The price is currently retesting a key horizontal resistance zone where sellers previously stepped in.
This zone aligns closely with the upper channel boundary, increasing confluence.
We could be witnessing a potential double top or a breakout build-up.
🔹 3. Volume Spike & Buyer Strength
Recent candles show increased volume — a possible signal that institutions are preparing for a larger move.
If volume increases further on breakout, it would confirm continuation.
🧭 Scenarios to Watch:
🟢 Bullish Scenario:
A strong breakout above the purple zone with a full-body candle close could signal:
A breakout from the ascending channel.
Fresh bullish momentum possibly targeting the 170.800–171.500 zone.
Ideal entry: On bullish retest of the breakout zone.
SL below breakout candle; TP at upper Fibonacci extensions.
🔴 Bearish Scenario (Double Top Rejection):
If price rejects the resistance zone again, forming a lower high or engulfing candle:
Expect a short-term pullback toward the midline or lower channel, around 168.500–168.000.
Bearish divergence with RSI or volume may confirm weakness.
This would create a Double Top inside the channel, often leading to a deeper correction.
📌 Conclusion:
EURJPY is at a make-or-break zone. The bullish structure remains intact, but the price must break and hold above the resistance to confirm strength. Until then, this could be a short-term exhaustion point.
🔄 Stay flexible. Watch volume, candle closes, and EMA behavior for confluence on your trade setup.
This analysis and chart work are entirely original and created from my own observations and strategy. Any resemblance to other posts is purely coincidental.
⚠️ Disclaimer:
This analysis is for educational and informational purposes only and does not constitute financial advice or a buy/sell recommendation. All views expressed are my own, based on personal technical interpretation.

Oderblock liquidity The market will create a structure within a structure to try to push the market back to the traps ,all you have to do is wait and be a friend of the trend
EURJPY SHORT DAILY FORECAST Q3 D30 W27 Y25EURJPY SHORT DAILY FORECAST Q3 D30 W27 Y25
Professional Risk Managers👋
Welcome back to another FRGNT chart update📈
Diving into some Forex setups using predominantly higher time frame order blocks alongside confirmation breaks of structure.
Let’s see what price action is telling us today! 👀
💡Here are some trade confluences📝
✅Daily Order block identified
✅4H Order Block identified
✅1H Order Block identified
🔑 Remember, to participate in trading comes always with a degree of risk, therefore as professional risk managers it remains vital that we stick to our risk management plan as well as our trading strategies.
📈The rest, we leave to the balance of probabilities.
💡Fail to plan. Plan to fail.
🏆It has always been that simple.
❤️Good luck with your trading journey, I shall see you at the very top.
🎯Trade consistent, FRGNT X

The Correlation Between EURJPY and NASDAQ You Shouldn't IgnoreCurrently keeping a close eye on EURJPY — price action has been bullish 📈, showing a strong upward push on the daily timeframe 🕒.
Right now, we’re seeing a bit of indecision 🤔, which is fairly typical for a Monday session as the market finds its footing.
🔍 I’m watching for continuation to the upside, as long as NASDAQ remains bullish. That said, NASDAQ is looking quite overextended 🧗, and a pullback could trigger a short-term retracement in the euro as well — these two tend to move in correlation 🔗, so keep a close watch on NAS100 for early clues.
If EURJPY consolidates sideways ⏸️, and we then get a clear break of market structure to the upside 🚀, I’ll be looking for a long setup on the retest and failure of the range floor — textbook continuation play 🎯.
As always, this is not financial advice — full breakdown in the video 🎥.

POTENTIAL SELL OPPORTUNITY IN EURJPYPrice is set drop from the current price after we encountered a resistant around the high of 169.836 a sell opportunity is envisaged from the current market price. Target profit is at 165.999

EURJPY 4hour TF - June 29th, 2025EURJPY 4hour Bullish Idea
Monthly - Bullish
Weekly - Bullish
Daily - Bullish
4hour - Bullish
EJ has been in a bullish trend on all timeframes and doesn’t really show any signs of stopping. Currently we are right near major monthly resistance around 171.000. It is likely we will see price action push into this zone but we want to identify a potential trade beforehand.
Here are two potential scenarios for this week on EJ
Bullish Continuation - We are a bit close to the 171.000 monthly zone so we would like to see price action come back to our 168.500 4hour support zone before targeting higher.
Trend Reversal - If we see price action fall below 168.500 we want to see bearish conviction and rejection from that same zone. If this happens we can start to consider short scenarios and target lower support levels like 166.250.

EURJPY ANALYSISAfter seeing the previous weekly candle close bullish confirming buying strength and it could continue into weekly highs and confluences on the daily and the 4hr suggest that too

EURJPY bullish continuation Price is still on uptrend on 3rd wave wave. What we should expect is small pullbacks and continuation up.
EURJPYAs our followers may remember, we already secured a great profit on EURJPY.
Now, we're once again waiting for price to revisit our key level — so we can potentially catch another high-probability setup.
📌 Always remember:
The market is unpredictable.
We're not here to predict — we're here to react, using technical analysis, clear setups, proper risk and trade management.
❌ If a level breaks, we don’t panic.
✅ Instead, we patiently wait for a pullback and take advantage of the next smart entry.

EURJPY POTENTIAL BUY OPPORTUNITY What next on EURJPY after the break of structure we recently had? From the technical perspective, trend remains strongly bullish therefore I anticipate price to breakout of the pennant triangle and retrace the previous resistance which is now broken to become a support. I’m bullish in EURJPY

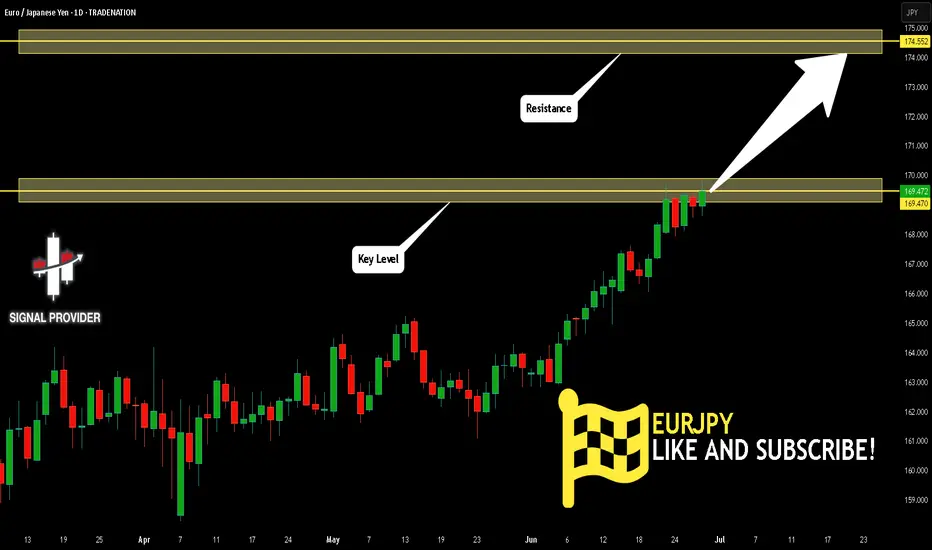
EURJPY Is Very Bullish! Long!
Take a look at our analysis for EURJPY.
Time Frame: 1D
Current Trend: Bullish
Sentiment: Oversold (based on 7-period RSI)
Forecast: Bullish
The market is on a crucial zone of demand 169.470.
The oversold market condition in a combination with key structure gives us a relatively strong bullish signal with goal 174.552 level.
P.S
Please, note that an oversold/overbought condition can last for a long time, and therefore being oversold/overbought doesn't mean a price rally will come soon, or at all.
Disclosure: I am part of Trade Nation's Influencer program and receive a monthly fee for using their TradingView charts in my analysis.
Like and subscribe and comment my ideas if you enjoy them!
Eur/Jpy breaks the previous🔍 Key Observations:
Supply Zone (169.713):
Price is approaching a marked supply zone, where sellers previously stepped in with strong momentum. This zone could act as a resistance area, potentially rejecting price downward.
Previous Low Break:
The structure shows that price broke below a previous low, indicating bearish pressure and a possible shift in market sentiment.
Demand Zone Below (~168.700):
There's a strong demand zone marked below the current price, which may serve as a target for short sellers or an area for bullish entries if reached.
Projected Move (Orange Arrows):
The orange path suggests a potential move:
Price may first retest the supply zone around 169.713.
A rejection from that level could trigger a downward move, breaking recent support levels.
The price may bounce slightly midway before continuing the drop toward the demand zone.
RSI Indicator (Relative Strength Index):
Currently at 54.80 (blue line), the RSI is nearing overbought territory but not yet extreme. This leaves room for a bit more upside before a potential reversal, aligning with the idea of testing the supply zone first.
