EURJPY SELL OPPORTUNITY!!Eur weakens against Japanese yen! A sell opportunity is envisaged upon price closing below the trendline (162.599) we anticipate more drop in price. Target profit is at 161.710
EURJPY trade ideas

Weekly analysis on EURJPYDaily update chart with MAKA Channel, I hope it will the idea for swing trader

EURJPYMacro Economic Analysis / Fundamental Analysis
The ECB has kept the rates while also BOJ kept the rates at the moment. In the short term we expect the ECB to cut the rates whilst the BOJ to raise the rate, probably in the next meeting. So in overall, we expect the JPY to strengthen against the EURO.
Technical Analysis
We expect a liquidity sweep of the previous week candle, then a sharp fall of the EURJPY.

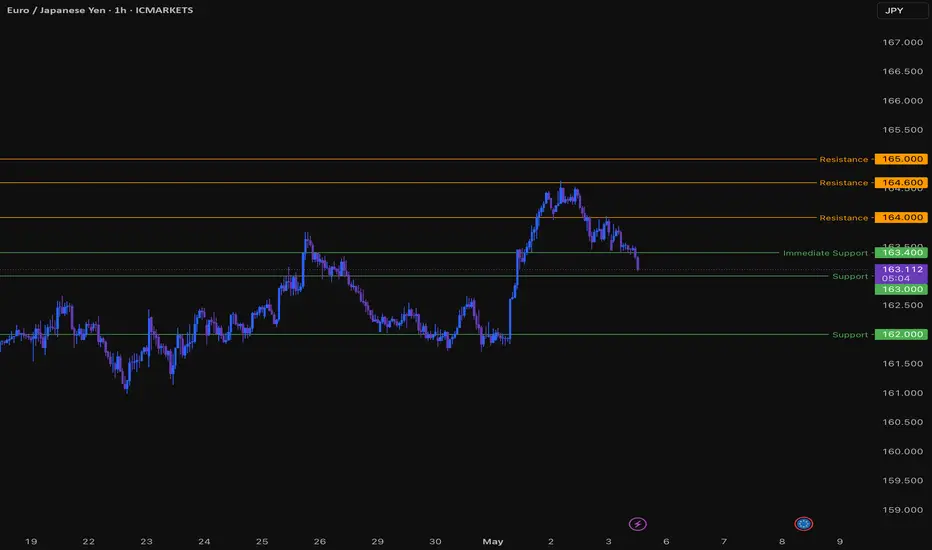
EURJPY Trade IdeaEUR/JPY showed a minor sell-off as yen gains due to tariff uncertainty. It hits an high of 164.60 and is currently trading around 163.41. Intraday outlook is bullish as long as the support 163 holds.
Technical Analysis:
The EUR/JPY pair is trading above 34, below 55 EMA and above 200-4H EMA on the 4- hour chart.
Near-Term Resistance: Around 164 a breakout here could lead to targets at 164.60/ 165/166.65/167.
Immediate Support: At 163.40 if breached, the pair could fall to 163/162/ 161.49/160.50/160/ 159.25/158.85/158.25.
Indicator Analysis 4-hour chart):
CCI (50): Bullish
Average Directional Movement Index: Neutral
Overall, the indicators suggest a mixed trend
Trading Recommendation:
It is good to buy on dips around 163 with a stop loss at 162 for a TP of 165/166.65.
EUR/JPY Weekly Analysis📊 EUR/JPY Weekly Analysis
🔍 Technical Insight by Shaker Trading
🔻 Bearish Market Structure:
Strong Descending Channel (Daily):
The pair is currently moving within a clear downward channel on the daily timeframe, reflecting continued bearish pressure.
Key Demand Zones (Daily):
Several strong demand areas are visible on the daily chart, which could serve as potential bounce points.
Overbought Signals on RSI & MACD:
Both the RSI and MACD indicators are showing signs of overbought conditions, suggesting the bullish momentum may be weakening.
📌 Trading Outlook:
We expect the bearish movement to continue. However, short-term pullbacks may occur from the demand zones before resuming the downtrend. Trade with caution and wait for confirmation signals.
🔥 Copy Trading for Free
Let our team handle the trades while you sit back and watch the results – totally free of charge.

EURJPY BUYIn this video we can see that the pair closed really bullish last week breaking above key area of resistance on the daily and on the 4hr too, we could expect a continuation of that move to the upside with the confluences listed out in the video.

EURJPY Technical & Order Flow Analysis (Potential Breakout)Our analysis is based on multi-timeframe top-down analysis & fundamental analysis.
Based on our view, the price will rise to the monthly level.
DISCLAIMER: This analysis can change anytime without notice and is only for assisting traders in making independent investment decisions. Please note that this is a prediction, and I have no reason to act on it, and neither should you.
Please support our analysis with a boost or comment!


EURJPY - 05.05.2025 - 09.05.2025EURJPY - 05.05.2025 - 09.05.2025
I am looking for short in EURJPY this week.

EJ - Short ideaHi team
we have this EURJPY short for WK19
Patience is the key guys , nobody will give you 100% a month remember earning just 1% a month beats 99% of retail community
Thank you !

"EURJPY Rejecting Premium FVG | Smart Money Trap in Play!"EURJPY Analysis 🧠 | 15M Timeframe
Price has tapped into the Premium Area, reacting off a high-probability Fair Value Gap (FVG) and Order Block confluence.
Signs of rejection are starting to show, but momentum wasn't strong enough to push lower before hitting breakeven.
Key Observations:
Price aggressively tapped the Premium zone (around 79% retracement).
Reaction from the embedded Fair Value Gap inside the premium zone.
Possible minor liquidity sweep above recent highs (Strong High marked).
Discounted zone below remains wide open as a potential future target.
🧠 Smart Money Concept Insight:
Big players often drive price into a Premium Area, triggering breakout trades and trapping liquidity.
After the liquidity is harvested, price tends to rebalance into the Discount Area.
Today, price showed initial bearish reaction but lacked immediate continuation strength — resulting in breakeven protection hit.
Current Trading Plan:
Continue monitoring EURJPY for renewed bearish order flow signs.
TP1 (if re-entry occurs): Mid Discount Area
TP2: Weak Low liquidity sweep below
SL (for any re-entries): Above Strong High
Remember:
📚 Premium = Look for Sell Opportunities
📚 Discount = Look for Buy Opportunities
Stay patient, protect your capital, and wait for price to confirm the next move.
📉 Focus on Smart Money footprints, not emotions.

Elite Validity Check | EUR/JPY
🔖 Header
Current Price & Spread** | **162.176 / 162.20
| **Timestamp (EST)** | 2025-04-29 01:20 |
| **Risk-Level Tag** | **Medium-High** – trading near yearly highs ahead of key EUR data |
| **Bias Checklist** | HTF trend ✅ | confluence ✅ | fundamentals ⚠️ |
| **Confidence Label** | **Technical High / Event-Risk Medium → Overall High** |
---
### 1️⃣ Technical Outlook
* **Multi-TF Trend (W1/D1/H4)** – **Bullish** (higher highs since Nov-24). Price pressing the 2025 top-of-range. ( [EUR JPY Chart – Euro Yen Rate -
* **Structure & Liquidity** –
* **Support**: 161.60-161.30 (H4 OB + prior swing).
* **Resistance**: 162.80 (Feb-25 high) → next liquidity **163.70-164.00** (2024 peak) (
* **Momentum Scan** – Weekly RSI 68 (near overbought); Daily MACD positive but histogram flattening (momentum pause). (
* **Volume** – Monday’s EU session candle closed 22 % above its 20-day avg tick volume (breakout confirmation).
( [EUR/JPY slips below 163.00 as trade-related uncertainties benefit
---
### 2️⃣ Primary Alert Zones
| Zone | Price | Type | Setup Idea 📝 |
|---|---|---|---|
| **Pullback Demand** | **161.60-161.30** | H4 OB + 50 DMA | M15 bullish engulf + > 20 % vol |
| **Breakout Supply** | **162.80-163.00** | Feb swing-high | Scale-out / watch false-break |
---
### 3️⃣ Indicators Snapshot
| Metric | Value | Read-out |
|---|---|---|
| RSI (H4) | 64 | bullish but near hot zone |
| MACD (D1) | >0, hist ↓ | waning momentum |
| ATR 14 (1 h) | **≈ 21 pips** (7-day avg)
| IG Sentiment | **~62 % short** (contrarian bullish)
---
### 4️⃣ Fundamental & Sentiment Radar
* **Tue 02:00** – German CPI flash (EUR).
* **Tue 05:00** – EZ flash GDP & HICP.
* **Thu Japan** – Tokyo CPI (early BoJ inflation gauge).
* **BoJ Outlook** – Next policy mtg ≙ Jun 13; officials jawboning JPY strength → risk of verbal intervention.
* **COT (22 Apr)** – Funds **net-long EUR / net-short JPY** → structural tail-wind. (

EURJPY: TGIF setup 3same quoted currency, I used the same strategy to test on this Friday JST time. currently all blue but I will see how London open.
#propfirm #100K
EURJPY BUY position I'm expecting to see rejection on 30min on the order block (rectangular box) which gonna present continuation towards the upside

EURJPYEUR/JPY Rate Differential and Fundamental Outlook for May 2025
Interest Rate Differential
ECB Main Refinancing Rate: 2.40% (after a 25 bps cut in April 2025).
BoJ Policy Rate: 0.50% (held steady in May 2025).
Rate Differential: 1.90 percentage points (EUR yield advantage).
This gap supports EUR/JPY upside, but the ECB’s easing bias and BoJ’s cautious stance suggest potential narrowing later in 2025.
Key May 2025 Fundamental Drivers
Eurozone (EUR)
GDP Growth:
Eurozone GDP grew 0.4% QoQ in Q1 2025, with Germany expanding 0.2%.
Resilient growth reduces urgency for aggressive ECB easing but does not halt the dovish trajectory.
ECB Policy Outlook:
Markets price in a 25 bps ECB rate cut in June, with further easing expected in 2025.
ECB remains data-dependent amid trade tensions and moderating inflation (2.1% in Germany, 0.8% in France).
Japan (JPY)
BoJ Policy Stagnation:
BoJ kept rates at 0.50% in May, citing risks from U.S. tariffs and downgrading 2025 GDP growth to 0.5%.
Core CPI forecasts trimmed to 2.2% for 2025 and 1.7% for 2026, delaying hawkish shifts.
Trade War Risks:
U.S.-China trade de-escalation optimism reduces JPY’s safe-haven appeal, but Japan’s export reliance keeps growth vulnerable.
Global Factors
Risk Sentiment: Easing U.S.-China tensions favor risk-on flows, weakening JPY.
Fed Policy: Delayed Fed cuts (4.50% rate) bolster USD, indirectly pressuring EUR/JPY via EUR/USD dynamics
ECB Rate Cuts (Expected) Bearish for EUR (narrows rate gap)
BoJ Dovish Hold Limits JPY strength, supports EUR/JPY upside
Eurozone Growth Resilience Mild EUR support, delays aggressive ECB easing
Trade Optimism Risk-on sentiment weakens JPY, bullish for EUR/JPY
Japan’s Growth Downgrade JPY weakness on economic concerns
Base Case:
EUR/JPY likely trades with a moderate bullish bias in May, supported by
The still-significant rate differential (1.90%).
Risk-on flows amid trade de-escalation.
BoJ’s growth and inflation downgrades limiting JPY strength.
Downside Risks:
Surprise ECB dovish rhetoric or faster-than-expected rate cuts.
Escalation in U.S.-Japan/EU trade tensions reviving JPY safe-haven demand.
Summary
The 1.90% rate differential and improving risk sentiment favor EUR/JPY gains in May, but the ECB’s easing trajectory and Japan’s structural challenges create volatility. Traders should monitor:
ECB June Policy Signals (potential 25 bps cut).
Eurozone Inflation Data (May 30–31).
BoJ Rhetoric on tariffs and growth.
While near-term upside persists, the pair’s longer-term outlook remains bearish as ECB cuts erode the rate advantage.

EURJPY: Short Trade Explained
EURJPY
- Classic bearish setup
- Our team expects bearish continuation
SUGGESTED TRADE:
Swing Trade
Short EURJPY
Entry Point - 163.91
Stop Loss - 164.69
Take Profit - 162.42
Our Risk - 1%
Start protection of your profits from lower levels
Disclosure: I am part of Trade Nation's Influencer program and receive a monthly fee for using their TradingView charts in my analysis.
❤️ Please, support our work with like & comment! ❤️

EURJPY Will Go Up From Support! Long!
Take a look at our analysis for EURJPY.
Time Frame: 1D
Current Trend: Bullish
Sentiment: Oversold (based on 7-period RSI)
Forecast: Bullish
The market is on a crucial zone of demand 163.939.
The oversold market condition in a combination with key structure gives us a relatively strong bullish signal with goal 168.000 level.
P.S
Please, note that an oversold/overbought condition can last for a long time, and therefore being oversold/overbought doesn't mean a price rally will come soon, or at all.
Disclosure: I am part of Trade Nation's Influencer program and receive a monthly fee for using their TradingView charts in my analysis.
Like and subscribe and comment my ideas if you enjoy them!

SHORT ON EUR/JPYEUR/JPY has created a head and shoulders pattern at a major resistance area.
I will be selling EJ to the pervious swing low / demand level.

EURJPY SIGNAL UPDATE READ CAPTAINeurjpy seel now entry point (164.200) TO (164.100) take profit 1 (163.900) take profit 2 (163.550) last target (163.200) stop loss (164.500) TECHINAL ANALYSIS SATUP FALLOW RISK MANAGMENT

Trendzilla vs Chop Kong (EUR/JPY)The bias for EUR/JPY - in our view - is higher
On the weekly timeframe:
A) WMA has flattened out and price held above it B) downtrend line broken and held
On daily timeframe:
EUR/JPY just broke resistance for possible breakout trade up to the olf high to 166 - and possibly beyond
Thoughts ?

EURJPY LongEURJPY is now net long on the regression break.
I am considering my options on this trade

EURJPY SELLTargets @ 160 - W 618 Fib @ 166.3 - LVN @ 154 which can be seen as Target - Waiting for Volume but already scaled in!

EUR-JPY Free Signals! Sell!
Hello,Traders!
EUR-JPY keeps growing
But the pair will soon hit
A horizontal resistance
Of 164.930 from where
We can enter a short trade
With the Target Level of 163.778
And the Stop Loss of 165.018
Sell!
Comment and subscribe to help us grow!
Check out other forecasts below too!
Disclosure: I am part of Trade Nation's Influencer program and receive a monthly fee for using their TradingView charts in my analysis.
