SELLGod First
Minimum Risk Maximum Reward
Action Backed Believe
# faith, strategy, and execution all in one #
EURJPY trade ideas

EURJPY: A Large Corrective Pattern in DevelopmentEURJPY: A Large Corrective Pattern in Development
The EURJPY currency pair recently encountered a significant resistance zone from above. Historically, the price has repeatedly declined after testing this dynamic zone, increasing the likelihood of another bearish movement.
Adding to the downward pressure is the Bank of Japan's (BOJ) influence. The BOJ's recent comments have created uncertainty and are driving down the value of currencies, including the yen.
You may find more details in the chart!
Thank you and Good Luck!
❤️PS: Please support with a like or comment if you find this analysis useful for your trading day❤️
Disclosure: I am part of Trade Nation's Influencer program and receive a monthly fee for using their TradingView charts in my analysis.

EURJPYEURJPY on monthly TF is bearish ,but bullish on daily .my aim is to look for buy opportunity from my demand floor to ride with the wave .the sentiment is bullish on daily.

EURJPY BUY/LONG 2HBy utilizing Fibonacci retracement levels, historical patterns, , we can formulate a hypothesis that the market might follow a similar trajectory if bearish sentiment prevails.

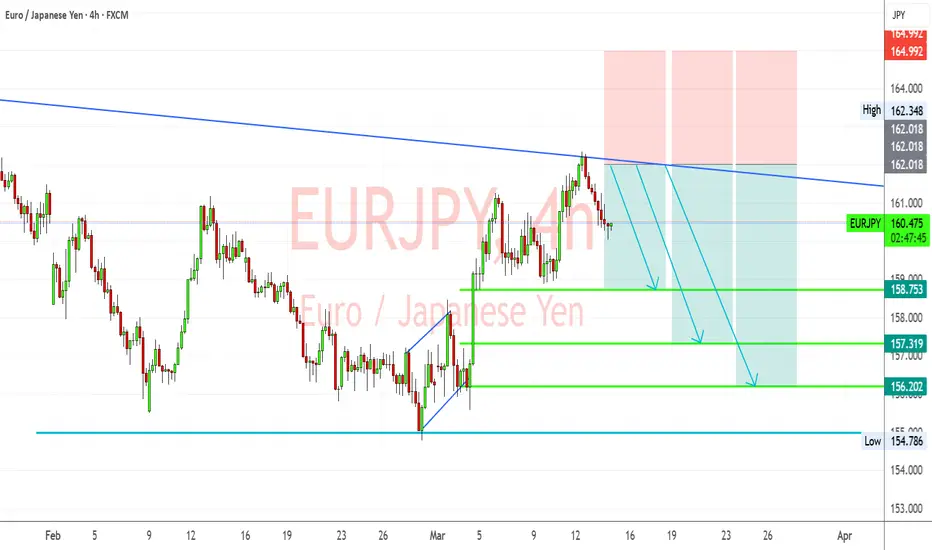
EUR/JPY Rejection at Trendline – Bearish Move Ahead?EUR/JPY 4-hour chart is respecting a long-term descending trendline, acting as dynamic resistance. Price recently tested this trendline near 162.018 - 164.073 and is now rejecting it, indicating a potential bearish move.
Bearish Confirmation & Entry:
Price failed to break above the 162.018 - 164.073 resistance zone, confirming a potential sell opportunity.
A downward movement is expected, targeting key support levels as marked.
Target Levels:
First Take Profit (TP1): 158.753 (Minor support zone)
Second Take Profit (TP2): 157.319 (Stronger support)
Third Take Profit (TP3): 156.202 (Significant demand area)
Final Take Profit (TP4): 154.786 (Major support and previous low)
Risk Management:
Stop-loss: Above 162.018 to protect against a potential breakout.
The trade setup offers a high risk-to-reward ratio, making it a strong candidate for a short position.
EURJPY Descending TriangleOn the Daily timeframe, we can see that a descending triangle pattern is being formed.
Statistically, this pattern breaks more often to the downside, which aligns with my primary wave count. Let's wait for some resolution outside the triangle boundaries.

Buy idsaDescending wedge indicating a possible short term bullish run on the hourly/30m time frame. Price seemed to have a faked a breakout earlier today, if all goes as planned, I expect a breakout on the upside and continuation to the price I have marked as a target on the chart!
Let me know what you think! Comments and/or suggestions highly appreciated! :)

EURJPY Buying Setuprading Idea: EUR/JPY Buying Setup
Market Context: The market has reached a previous resistance level, which has now turned into a support level, indicating a potential bullish continuation. accordingly TPS and SL is choosen.

EURJPY INTRADAY bullish breakout confirmation neededThe EUR/JPY currency pair price action sentiment remains bullish, underpinned by the prevailing long-term uptrend. Recent intraday movements indicate a bullish breakout above the previous resistance level, which has now established itself as a new support zone.
Key Levels and Price Action
The critical trading level to watch is 160.26, representing the previous consolidation range. A corrective pullback to this level, followed by a bullish rebound, could signal continued upward momentum. In this scenario, the pair may aim for upside resistance levels at 162.58, 163.22, and 163.66 over a longer timeframe.
However, if the 161.26 support level fails to hold and there is a confirmed daily close below it, the bullish outlook would be invalidated. This breakdown could trigger a deeper retracement, targeting the 160.55 support level, followed by 159.10.
Conclusion
The sentiment remains bullish as long as the 161.26 support level holds, with potential upside targets at 162.58, 163.22, and 163.66. A break below 161.26, however, would shift the outlook to bearish, signaling a potential move towards 160.55 and 159.10. Traders should closely monitor price action and daily closes around the key support to assess sentiment shifts and trading opportunities.
This communication is for informational purposes only and should not be viewed as any form of recommendation as to a particular course of action or as investment advice. It is not intended as an offer or solicitation for the purchase or sale of any financial instrument or as an official confirmation of any transaction. Opinions, estimates and assumptions expressed herein are made as of the date of this communication and are subject to change without notice. This communication has been prepared based upon information, including market prices, data and other information, believed to be reliable; however, Trade Nation does not warrant its completeness or accuracy. All market prices and market data contained in or attached to this communication are indicative and subject to change without notice.

EUR/JPY Technical Analysis | 2H Chart
📉 EUR/JPY is currently showing signs of rejection from a key descending trendline (green) after a strong bullish move.
📌 Key Observations:
✅ Resistance Zone (Purple Box): Price attempted to break but faced rejection.
✅ Support Levels: Watching 160.617 and lower 158.519 for potential downside targets.
✅ Bearish Momentum: The price is reacting from resistance, suggesting a possible short-term pullback.
✅ Breakout Scenario: A break above 161.834 could trigger bullish continuation toward 162.500+.
💡 Trading Plan:
🔸 If price re-tests resistance and holds, expecting a potential drop toward the 158.500 region.
🔸 A confirmed breakout above 161.834 could invalidate the bearish bias and lead to further upside.
📊 Keep an eye on upcoming economic events for volatility!
---

Multi-Timeframe Analysis for EUR/JPYTrade Bias: Bearish
The 4H chart shows a clear bearish trend with lower highs and lower lows since late February. The pair recently made a lower high around 162.400 and has been declining. The 1H chart confirms this bearish sentiment with price recently rejecting from the 161.000 resistance level.
Entry Price: 160.900
Looking to enter on a pullback to the 160.900 level, which has acted as a resistance zone in recent price action.
Stop Loss: 161.250
This gives us 35 pips of risk as requested, placing the stop above a recent swing high on the 1H chart.
Take Profit Levels:
Primary TP: 160.150 (75 pips reward)
Extended TP: 159.500 (140 pips reward)
Risk-to-Reward Ratio:
Primary TP: 1:2.14 (35 pips risk : 75 pips reward)
Extended TP: 1:4 (35 pips risk : 140 pips reward)
Trade Rationale:
4H Timeframe Context: The pair is in a broader downtrend, currently in a pullback phase after a strong decline from 162+ levels. There's significant resistance around the 161.200-161.500 zone.
1H Timeframe Confirmation: Price has formed a lower high and appears to be rejecting from the 161.000 zone, with bearish momentum increasing.
15m Timeframe Entry Precision: The recent price action shows consolidation after the decline, providing a potential entry on a small pullback.
Key Support Levels: 160.150 and 159.500 have both acted as significant support/resistance levels in the past, making them logical targets.
Market Structure: The consistent pattern of lower highs and lower lows across multiple timeframes suggests the bearish move has strength.
Entry Strategy:
Wait for price to pull back to 160.900
Confirm rejection with a bearish candle formation
Enter at market or with a limit order at 160.900
Set stop loss at 161.250
Partial take profit at 160.150, move stop to breakeven
Final target at 159.500

BUYGod First
Minimum Risk Maximum Reward
Action Backed Believe
# faith, strategy, and execution all in one #

short ideaThis Analysis Can Change At Anytime Without Notice And It Is Only For educational Purpose to Traders To Make Independent Investments Decisions.
Disclaimer
The information and publications are not meant to be, and do not constitute, financial, investment, trading, or other types of advice or recommendations supplied or endorsed by TradingView

EURJPY Bullish turnoverI am currently now waiting for EURJPY to give me any clear sign for me to participate the bullish movement.
At the moment right now i will be expecting bullish shift of momentum on either one of my buying zones.
For the TP i will be targeting on the yellow lines between ( 162 - 165 )

EURJPY 13.03.2025- Trump: "I'm not happy with EU"
~+ Trump: "period of transition" (recession fears)
~+ JP Labor union wage increase
- COT
~- Ukraine peace talks optimism

Great Win 78 pips.EUR JPY Entry
head and shoulders
fib 78.6
right shoulder rejection
3pin
EUR/JPY strengthens as the JPY weakens amid shifting safe-haven flows and an improvement in global risk sentiment.
Japan’s top companies are poised to implement substantial wage hikes for the third straight year to help workers cope with inflation.
The Euro gains as the Franziska Brantner-led German Green Party may back the approval of a defense spending deal.
EUR/JPY continues its upward momentum for the second consecutive day, trading around 161.60 during Wednesday’s Asian session. The pair strengthens as the Japanese Yen (JPY) weakens amid concerns that US President Donald Trump may introduce new tariffs on Japan.

EUR_JPY WILL GROW AFTER PULLBACK|LONG|
✅EUR_JPY is trading in an
Uptrend and the pair made a
Bullish breakout of the key
Horizontal level of 161.000
Which is now a support
And the pair is now making
A local pullback but we
Are bullish biased and after
The retest of the new support
We will be expecting a
Further move up
LONG🚀
✅Like and subscribe to never miss a new idea!✅

EURJPY in Downtrend ContinuationFollowing the daily timeframe trendline, after a change of character on the lower timeframe, we took the entry after the 162 support was breached. We are now targeting the nearest liquidity at 158.85
Sell Stop
Entry Price 162.00
Stop Loss 162.90
TP 158.85
Lot Size 0.40
Risk 1%

EURJPY Breakout in Play – Next Target 164.000?📈 Timeframe: 1H
📊 Broker: OANDA
💹 Current Price: 161.798
Key Technical Levels & Analysis
Descending Trendline Breakout Attempt
The price is currently testing a long-term descending trendline (marked in blue).
A successful breakout above this level could indicate a bullish continuation towards the 164.000 supply zone.
Support & Resistance Zones
Major Support: 159.000
Resistance Levels:
Immediate Resistance: 161.800 - 162.000 (Trendline & Supply Zone)
Next Target: 164.000 (Major Resistance Zone)
Potential Scenarios
Bullish Breakout Confirmation:
If price breaks & retests the trendline successfully, long positions can target 164.000.
Rejection Scenario:
If price fails to hold above 161.800, we might see a pullback towards 159.000 before any bullish continuation.
Trading Plan
✅ Buy Entry: After confirmation of breakout & retest above 161.800
🎯 Target: 164.000
📉 Stop Loss: Below 161.000
Risk Management
Wait for candle close confirmation before entering a trade.
Avoid FOMO and ensure the risk-reward ratio is at least 1:2 or 1:3.

EURJPY: Will Start Falling! Here is Why:
Remember that we can not, and should not impose our will on the market but rather listen to its whims and make profit by following it. And thus shall be done today on the EURJPY pair which is likely to be pushed down by the bears so we will sell!
Disclosure: I am part of Trade Nation's Influencer program and receive a monthly fee for using their TradingView charts in my analysis.
❤️ Please, support our work with like & comment! ❤️

EURJPY INTRADAY Bullish breakout supported at 161.26The EUR/JPY currency pair price action sentiment remains bullish, underpinned by the prevailing long-term uptrend. Recent intraday movements indicate a bullish breakout above the previous resistance level, which has now established itself as a new support zone.
Key Levels and Price Action
The critical trading level to watch is 161.26, representing the previous consolidation range. A corrective pullback to this level, followed by a bullish rebound, could signal continued upward momentum. In this scenario, the pair may aim for upside resistance levels at 162.58, 163.22, and 163.66 over a longer timeframe.
However, if the 161.26 support level fails to hold and there is a confirmed daily close below it, the bullish outlook would be invalidated. This breakdown could trigger a deeper retracement, targeting the 160.55 support level, followed by 159.10.
Conclusion
The sentiment remains bullish as long as the 161.26 support level holds, with potential upside targets at 162.58, 163.22, and 163.66. A break below 161.26, however, would shift the outlook to bearish, signaling a potential move towards 160.55 and 159.10. Traders should closely monitor price action and daily closes around the key support to assess sentiment shifts and trading opportunities.
This communication is for informational purposes only and should not be viewed as any form of recommendation as to a particular course of action or as investment advice. It is not intended as an offer or solicitation for the purchase or sale of any financial instrument or as an official confirmation of any transaction. Opinions, estimates and assumptions expressed herein are made as of the date of this communication and are subject to change without notice. This communication has been prepared based upon information, including market prices, data and other information, believed to be reliable; however, Trade Nation does not warrant its completeness or accuracy. All market prices and market data contained in or attached to this communication are indicative and subject to change without notice.

STBB FX Weekly Analysis - Week 11 2025Tradingview Ideas:
Hello fellow traders , my regular and new friends!
Welcome and thanks for dropping by my Video!
I am giving updates on my Weekly Analysis, mainly in the forex market!
Do check them out!
-- Get the right tools and an experienced Guide, you WILL navigate your way out of this "Dangerous Jungle"! --

EURJPY Short Term Buy IdeaH4 - Bullish trend pattern
Expecting corrections now and then potential continuation higher until the two strong support zones hold.
