EURJPY SELL PROJECTION As we can see , is all about same thing. Trendline breakout+ pullback+ liquidity sweep+ execution.
Once price takes out that high and pullback to the sell zone, we go short
EURJPY trade ideas

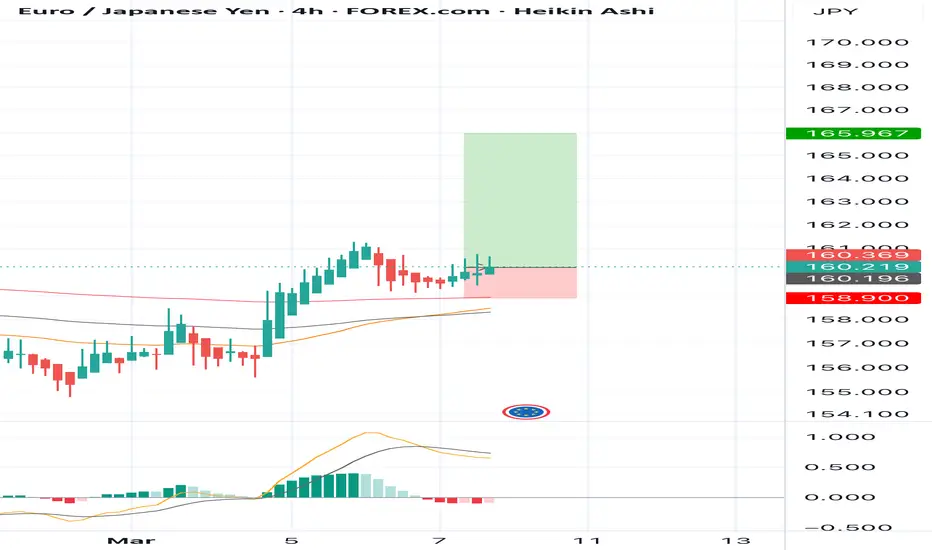
BUY EURJPY for bearish trend reversal STOP LOSS : 158.90 BUY EURJPY for bearish trend reversal
STOP LOSS : 158.90
Regular Bullish Divergence
In case of Regular Bullish Divergence:
* The Indicator shows Higher Lows
* Actual Market Price shows Lower Lows
We can see a strong divergence on the MACD already and There is a strong trend reversal on the daily time frame chart.....
The daily time frame is showing strength of trend reversal from this strong level of Support so we are looking for the trend reversal and correction push from here .....
TAKE PROFIT : take profit will be when the trend comes to an end, feel from to send me a direct DM if you have any question about take profit or anything
Remember to risk only what you are comfortable with…….trading with the trend, patient and good risk management is the key to success here
EURJPY TRADE SETUPWait for retest the entry level then take a trade for buy otherwise skip this setup

EURJPY shortEEURJPY has been ranging on this point and after a touch on the resistance price bounced and is reversing to touch it again. Expecting a move down
Support and ResistanceGood day traders, hope you are all well. As you can see in the setup above, we are looking to go long on EURJPY. This bias is based on pair correlation, technical analysis and chart patterns. the path i drew just gives the structure of the direction where i expect price to go, scale down the timeframes to accommodate your accounts and get more detail to price.

EUR/JPY Short Setup | Key Resistance Rejection & Bearish OutlookEUR/JPY is currently testing a key resistance zone around 160-161. If price rejects this level, we can anticipate a potential drop towards the 156 support zone.
There are two possible bearish scenarios:
A direct rejection from the resistance zone, leading to a bearish move towards 156.
A minor bullish breakout above 161, followed by a deeper pullback before resuming the bearish trend.
This analysis is based on past price action and key supply-demand zones. A strong confirmation at resistance (such as a bearish engulfing candle or a lower high formation) could be a good entry signal.
📉 Potential Target: 156
🚀 Invalidation Level: Above 163 (Break & Close)
📊 Risk Management: Proper stop-loss placement above 161.5/163
Would you like me to refine this further based on your specific trading style?

EUR/JPY Trade Setup Bullish Breakout StrategyEUR/JPY trade setup is based on a **bullish breakout strategy**. Here’s a breakdown of the analysis:
**🔹 Trade Details:**
- **Entry at 160.200:** This level is identified as a good buying point, likely after a breakout or strong upward momentum.
- **Stop Loss at 159.500:** If the price reverses and hits this level, the trade will be closed to limit potential losses.
- **Target at 161.200:** The price is expected to reach this level if the bullish momentum continues.
### **📊 Why This Trade?**
1. **Resistance Breakout:** If EUR/JPY breaks a key resistance level, it could trigger more buying pressure, pushing the price higher.
2. **Strong Buy Zone:** After breaking resistance, the market often enters a phase where buyers dominate.
3. **Risk Management:** The stop loss is placed to minimize potential downside, ensuring a controlled risk-to-reward ratio.
📌 **Conclusion:** If the price breaks above resistance and holds, it’s a strong buy setup. However, always use proper risk management to protect your capital. 🚀📈

EURJPY The Target Is DOWN! SELL!
My dear followers,
I analysed this chart on EURJPY and concluded the following:
The market is trading on 160.16 pivot level.
Bias - Bearish
Technical Indicators: Both Super Trend & Pivot HL indicate a highly probable Bearish continuation.
Target - 158.40
Safe Stop Loss - 160.90
About Used Indicators:
A super-trend indicator is plotted on either above or below the closing price to signal a buy or sell. The indicator changes color, based on whether or not you should be buying. If the super-trend indicator moves below the closing price, the indicator turns green, and it signals an entry point or points to buy.
———————————
WISH YOU ALL LUCK

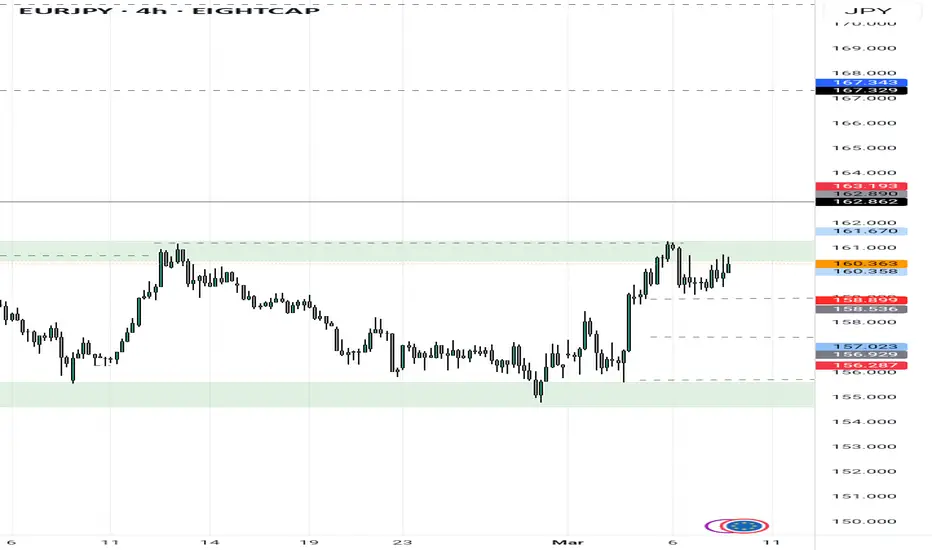
EURJPY is currently inside a large trading range pattern.EURJPY is currently inside a large trading range pattern.
Since the end of January, EUR/JPY has been moving in a volatile manner within a large trading range. This range is nearly 600 pips long and has kept EUR/JPY confined within this zone.
The reason for this volatility is related to fundamental factors from both the ECB and BOJ.
So far, EUR/JPY has tested the top of the structure again, and there are chances that it could move down to test the bottom near 155.00. It's important to be very careful because the market has been very unpredictable lately, but this setup could work out well.
You may find more details in the chart!
Thank you and Good Luck!
❤️PS: Please support with a like or comment if you find this analysis useful for your trading day❤️
Disclosure: I am part of Trade Nation's Influencer program and receive a monthly fee for using their TradingView charts in my analysis.

EURJPY - Follow the Bears!Hello TradingView Family / Fellow Traders. This is Richard, also known as theSignalyst.
📉EURJPY has been overall bearish trading within the falling wedge pattern marked in red.
Since it is retesting the upper bound of the wedge, I will be looking for trend-following sell setups on lower timeframes.
For now, we wait!⏱️
📚 Always follow your trading plan regarding entry, risk management, and trade management.
Good luck!
All Strategies Are Good; If Managed Properly!
~Rich
Disclosure: I am part of Trade Nation's Influencer program and receive a monthly fee for using their TradingView charts in my analysis.
EURJPY: Bullish Move From Support 🇪🇺🇯🇵
EURJPY looks bullish after a completion
of a consolidation on a key daily/intraday support.
A formation of a bullish imbalance candle provides a strong bullish confirmation.
I think that the price will go up and hit at least 160.33 level.
❤️Please, support my work with like, thank you!❤️

EUR/JPY Technical AnalysisTrendline Breakout:
EUR/JPY has broken a long-standing descending trendline, which previously acted as dynamic resistance, pushing the price lower. The breakout indicates a potential trend reversal from bearish to bullish.
Retesting Support Zone:
After the breakout, the price has retraced back to a key support zone around 156.000, highlighted in purple. This area has previously acted as a strong demand zone, where buyers have stepped in multiple times. Retesting this zone is a natural price action movement before confirming further upside momentum.
Bullish Projection:
If the support at 156.000 holds, EUR/JPY is expected to resume its bullish movement towards key resistance levels at 158.000 and ultimately 160.000. These levels align with previous price reaction zones, making them crucial take-profit areas for buyers.

EURJPY 4h Falling Wedge EUR/JPY – 4H Chart Analysis (March 6, 2025)
1. Market Structure & Trend Analysis
Falling Wedge Breakout: Price was previously in a descending channel, forming a falling wedge pattern, which is a bullish reversal signal.
Strong Breakout & Momentum: The breakout led to a sharp rally, confirming bullish intent.
Retest of 159.87: Price is currently retesting the 159.87 support zone, which was a previous resistance level.
2. RSI & Momentum Analysis
RSI at 63.92: Indicates strong bullish momentum but not overbought yet.
Healthy Pullback: The RSI shows a minor retracement, suggesting that price may be stabilizing before another push higher.
3. Key Levels to Watch
Support:
159.87 (Current retest level; previous resistance turned support)
156.38 (Major support below if price breaks down)
Resistance:
160.50 - 161.00 (Current local resistance zone)
162.00+ (Next major resistance if the uptrend continues)
4. Potential Trade Scenarios
📈 Bullish Scenario (Higher Probability)
If 159.87 holds as support, price could continue the uptrend towards 161.00+.
Long Setup:
Entry: 159.80 - 160.00 (on confirmation of support hold)
Stop-loss: Below 159.50
Target: 161.00, then 162.00
📉 Bearish Scenario (Lower Probability)
If price fails to hold above 159.87, we could see a deeper retracement toward 156.38.
Short Setup:
Entry: Below 159.50
Stop-loss: Above 160.00
Target: 157.50, then 156.50
5. Conclusion & Strategy
Bias: Bullish, but waiting for confirmation of support at 159.87.
Trade idea: A retest of 159.87 holding as support could provide a strong buy opportunity for continuation to 161.00 - 162.00.
Risk management: If price breaks below 159.50, consider avoiding longs and waiting for a deeper retracement.

EURJPY: Short Trade with Entry/SL/TP
EURJPY
- Classic bearish setup
- Our team expects bearish continuation
SUGGESTED TRADE:
Swing Trade
Short EURJPY
Entry Point - 159.79
Stop Loss - 160.94
Take Profit - 157.84
Our Risk - 1%
Start protection of your profits from lower levels
Disclosure: I am part of Trade Nation's Influencer program and receive a monthly fee for using their TradingView charts in my analysis.
❤️ Please, support our work with like & comment! ❤️

EURJPY INTRADAY Breakout retest ahead of ECB decision? Bullish Scenario:
The EURJPY currency pair appears bullish, supported by the recent bullish breakout of the longer-term trend. The recent intraday price action indicates a bullish breakout above a period of sideways consolidation. The key level to watch is 158.50, which marks the breakout zone and aligns with the previous falling resistance trendline , now newly formed support zone. A corrective pullback that finds support at 158.50, followed by a bullish rebound, could trigger further upside movement towards 160.00, with extended targets at 161.33 and 162.00 over a longer timeframe.
Bearish Scenario:
A confirmed breakdown below the 158.50 level, particularly with a daily close beneath this support, would negate the bullish outlook. This would expose the index to a deeper retracement, with immediate support at 157.35, followed by 156.00 indicating a potential shift towards a corrective phase.
Conclusion:
The broader trend remains bullish, but 158.50 is a pivotal level. Holding above this zone reinforces upside potential, while a decisive break below it could lead to increased selling pressure. Traders should monitor price action around this key level to confirm the next directional move.
This communication is for informational purposes only and should not be viewed as any form of recommendation as to a particular course of action or as investment advice. It is not intended as an offer or solicitation for the purchase or sale of any financial instrument or as an official confirmation of any transaction. Opinions, estimates and assumptions expressed herein are made as of the date of this communication and are subject to change without notice. This communication has been prepared based upon information, including market prices, data and other information, believed to be reliable; however, Trade Nation does not warrant its completeness or accuracy. All market prices and market data contained in or attached to this communication are indicative and subject to change without notice.

DeGRAM | EURJPY growth in the channelEURJPY is in a descending channel between trend lines.
The price is moving from the lower boundary of the channel and support level, and the 38.2% retracement level is the nearest obstacle to growth.
The chart retains a descending structure, but it has already formed a harmonic pattern.
On the 4H Timeframe, the indicators are pointing to a bullish convergence.
We expect growth in the channel after consolidation above the 38.2% retracement level.
-------------------
Share your opinion in the comments, and support the idea with a like. Thanks for your support!

EURJPY: Overbought Market & Pullback 🇪🇺🇯🇵
I see a local bearish reversal on EURJPY.
The price formed a tiny double top after a test
of the underlined supply zone.
We can expect a correctional movement at least to 106.26 level today.
❤️Please, support my work with like, thank you!❤️


EUR/JPY is currently in a bearish trendEUR/JPY is currently in a bearish trend, with strong selling pressure driving the pair lower. On the daily and 4-hour charts, the price is trading below key resistance levels and moving averages, signaling further downside potential.
The pair recently broke below a key support zone around 161.50, turning it into resistance. The RSI is trending below 50, confirming bearish momentum, while the MACD is below the signal line, supporting further declines. A descending trendline is also capping upside moves.
The next weekly support level is around 159.80, which aligns with a previous demand zone. If the price fails to reclaim 161.50 and rejects lower, it could provide a strong shorting opportunity. A confirmed break below 159.80 would open the door for further declines toward 158.50.
Tariff Trade Between the EU and the USA
Tariffs between the European Union (EU) and the United States have historically been a source of economic tension. These trade duties impact industries such as automobiles, steel, agriculture, and technology.
EU Tariffs on US Goods: The EU imposes tariffs on American products like whiskey, motorcycles, and agricultural goods in response to US trade policies.
US Tariffs on EU Goods: The US has targeted European steel, aluminum, and luxury goods, arguing unfair subsidies and trade imbalances.
Retaliation & Trade Wars: Disputes, such as those involving Airbus vs. Boeing subsidies, have led to retaliatory tariffs, affecting global trade.
Recent Developments: The Biden administration and EU officials have worked on reducing tariffs, but tensions remain, especially in green energy subsidies and technology sectors.
If new tariffs arise, they could impact EUR/JPY indirectly through risk sentiment, potentially strengthening the Japanese Yen (JPY) as a safe-haven asset and increasing EUR downside pressure.
Traders should look for price action signals like bearish engulfing candles or trendline rejections to confirm entry. Stops should be placed above the recent highs for risk management.

EURJPY Approaching Major Support – Will Buyers Step In?OANDA:EURJPY is approaching a significant support zone, highlighted by previous price reactions and strong buying interest. This area has historically acted as a key demand zone, increasing the likelihood of a bounce if buyers step in.
The current market structure suggests that if the price confirms support within this zone, we could see a bullish reversal. A successful rebound could push the pair toward the 160.000 level, a logical target based on past price behavior and structural confluence.
Just my take on support and resistance zones—not financial advice. Always confirm your setups and trade with solid risk management.
Best of luck!

eurjpy is bullishthe pair has already made a head and shoulder pattern at the end of its bearish move and seems to bounce back toward depicted area on the chart
we are following the case for long position
let see what the market will play out

EURJPY - Bullish Continuation Toward 160.850OANDA:EURJPY is trading within a well-defined ascending channel, with price action respecting both the upper and lower boundaries. The recent bounce off support suggests buyers are maintaining control, supporting a potential continuation of the uptrend.
As long as the price remains above the support level and the channel's lower boundary holds, the bullish structure remains intact.
A potential upside target is 160.850, aligning with the upper boundary of the channel. A break and close above this level could signal further bullish momentum.
However, a breakdown below the support zone would invalidate the bullish scenario and may open the door for a deeper pullback.
Remember, always confirm your setups and trade with solid risk management.
Best of luck!

EURJPY Technical Analysis! SELL!
My dear subscribers,
EURJPY looks like it will make a good move, and here are the details:
The market is trading on 159.58 pivot level.
Bias - Bearish
My Stop Loss - 160.34
Technical Indicators: Both Super Trend & Pivot HL indicate a highly probable Bearish continuation.
Target - 158.15
About Used Indicators:
The average true range (ATR) plays an important role in 'Supertrend' as the indicator uses ATR to calculate its value. The ATR indicator signals the degree of price volatility.
———————————
WISH YOU ALL LUCK
