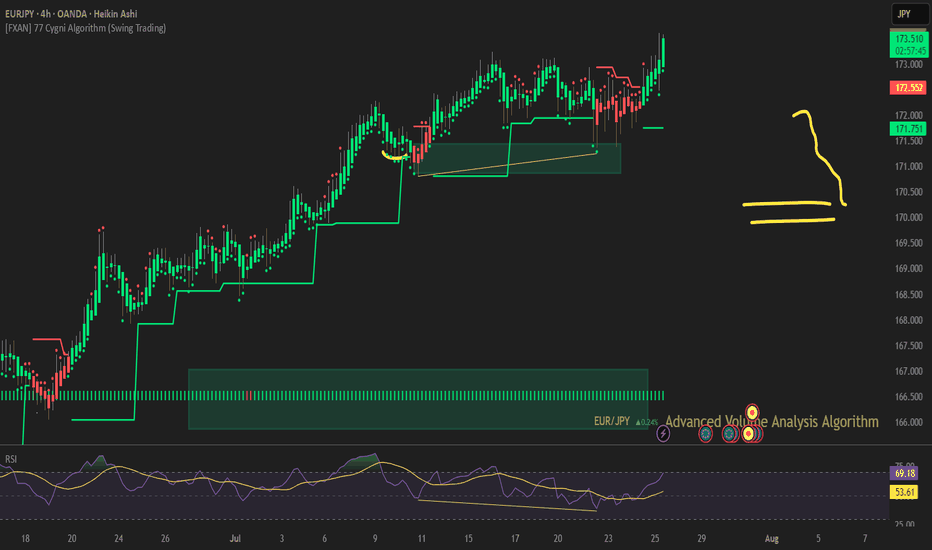
EURJPY trade ideas
EUR/JPY "The Yuppy" Forex Bank Heist Plan (Swing / Day Trade)🌟Hi! Hola! Ola! Bonjour! Hallo! Marhaba!🌟
Dear Money Makers & Robbers, 🤑 💰💸✈️
Based on 🔥Thief Trading style technical and fundamental analysis🔥, here is our master plan to heist the EUR/JPY "The Yuppy" Forex Market. Please adhere to the strategy I've outlined in the chart, which emphasizes long entry. Our aim is to escape near the high-risk ATR Zone. Risky level, overbought market, consolidation, trend reversal, trap at the level where traders and bearish robbers are stronger. 🏆💸"Take profit and treat yourself, traders. You deserve it!💪🏆🎉
Entry 📈 : "The heist is on! Wait for the MA breakout (163.500) then make your move - Bullish profits await!"
however I advise to Place Buy stop orders above the Moving average (or) Place buy limit orders within a 15 or 30 minute timeframe most recent or swing, low or high level for Pullback entries.
📌I strongly advise you to set an "alert (Alarm)" on your chart so you can see when the breakout entry occurs.
Stop Loss 🛑: "🔊 Yo, listen up! 🗣️ If you're lookin' to get in on a buy stop order, don't even think about settin' that stop loss till after the breakout 🚀. You feel me? Now, if you're smart, you'll place that stop loss where I told you to 📍, but if you're a rebel, you can put it wherever you like 🤪 - just don't say I didn't warn you ⚠️. You're playin' with fire 🔥, and it's your risk, not mine 👊."
📍 Thief SL placed at the recent/swing low level Using the 4H timeframe (5100) Day trade basis.
📍 SL is based on your risk of the trade, lot size and how many multiple orders you have to take.
🏴☠️Target 🎯: 165.700 (or) Escape Before the Target
🧲Scalpers, take note 👀 : only scalp on the Long side. If you have a lot of money, you can go straight away; if not, you can join swing traders and carry out the robbery plan. Use trailing SL to safeguard your money 💰.
💰💵💸EUR/JPY "The Yuppy" Forex Market Heist Plan (Scalping/Day) is currently experiencing a bullishness,., driven by several key factors. 👇👇👇
📰🗞️Get & Read the Fundamental, Macro, COT Report, Quantitative Analysis, Sentimental Outlook, Intermarket Analysis, Future trend targets..., go ahead to check 👉👉👉🔗
⚠️Trading Alert : News Releases and Position Management 📰 🗞️ 🚫🚏
As a reminder, news releases can have a significant impact on market prices and volatility. To minimize potential losses and protect your running positions,
we recommend the following:
Avoid taking new trades during news releases
Use trailing stop-loss orders to protect your running positions and lock in profits
💖Supporting our robbery plan 💥Hit the Boost Button💥 will enable us to effortlessly make and steal money 💰💵. Boost the strength of our robbery team. Every day in this market make money with ease by using the Thief Trading Style.🏆💪🤝❤️🎉🚀
I'll see you soon with another heist plan, so stay tuned 🤑🐱👤🤗🤩
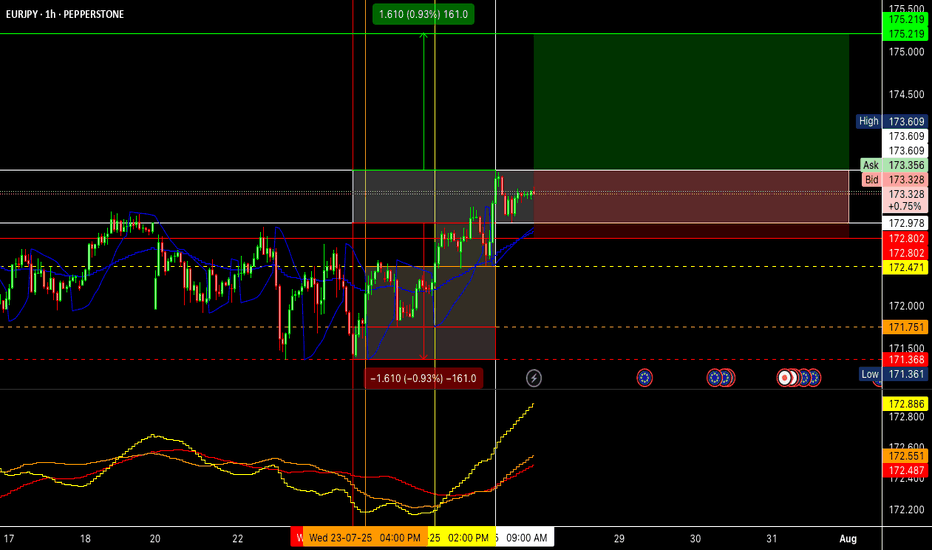
Buy EURJPY
The jpy pairs real value as been clear since last month but tho to different factors such as USA trade war and other .. it asn't been able to move according to its value .. buy EUR and CAD as managed to show it's value will all that as happed since last month ... It's well positioned for a strong buy whenever jpy choose to go up
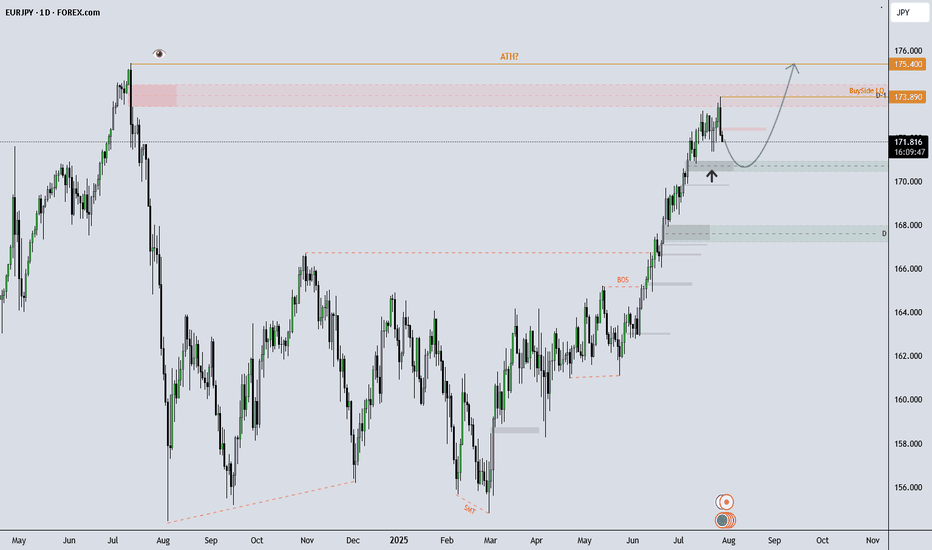
EUR/JPY Eyes Breakout — Can Bulls Push Through Resistance?EUR/JPY Weekly Chart Analysis
EUR/JPY is holding strong above a rising trendline that’s acted as support since 2022. The pair recently bounced from a key support zone and is now testing a major resistance area.
A breakout above this zone could trigger a bullish continuation, while rejection may lead to another pullback toward the trendline.
Key Levels:
Support: 153.5–155.0
Resistance: 163.5–165.0
Watch for: Weekly close above resistance for bullish confirmation.
Structure remains bullish as long as the trendline holds.
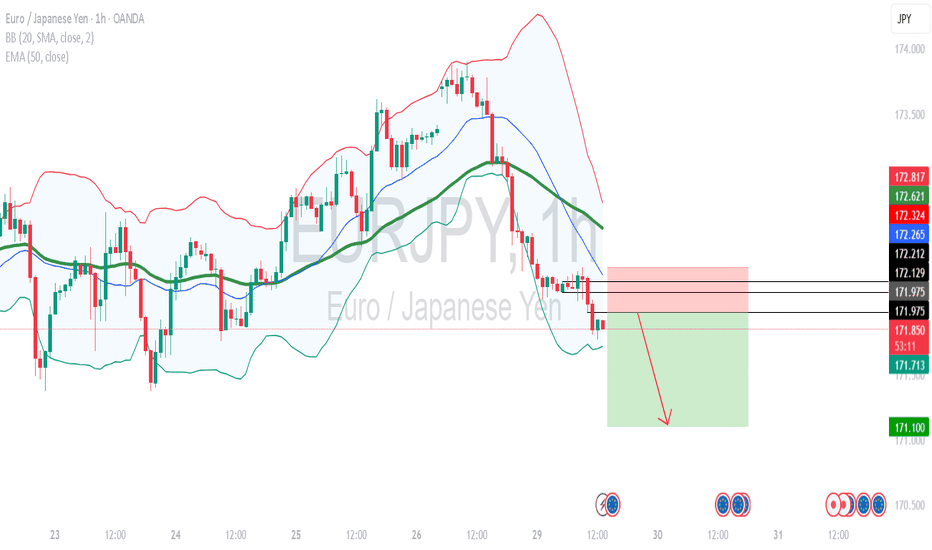
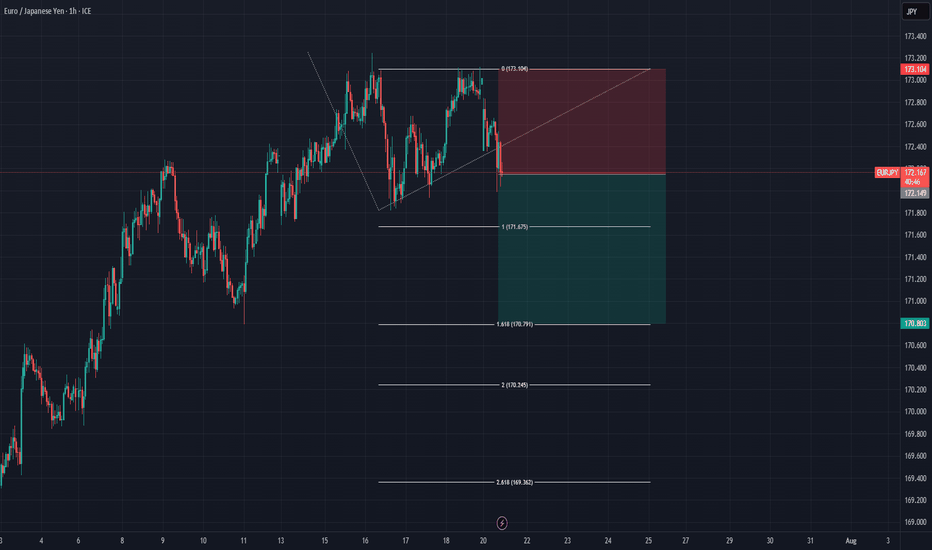
SHORT / EUR/JPYPrice has broken previous structure. This is the first indication I would take in my trading to before placing a trade. We can see in the charts that the price has broken through medium risk zone and is now heading to low risk zone. I would be looking for a short position there as it is closer to my invalidation level. This allows me to leverage a higher position with minimalized risk.
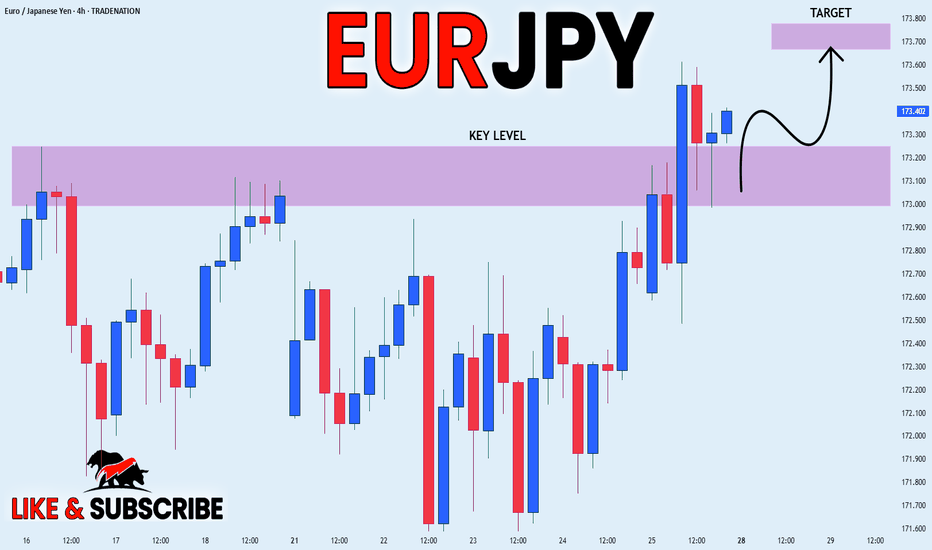
EUR_JPY SHORT FROM SUPPLY LEVEL|
✅EUR_JPY is set to retest a
Strong resistance level above
After trading in a local uptrend for some time
Which makes a bearish pullback a likely scenario
With the target being a local support below
SHORT🔥
✅Like and subscribe to never miss a new idea!✅
Disclosure: I am part of Trade Nation's Influencer program and receive a monthly fee for using their TradingView charts in my analysis.
EUR/JPY Short🎯 Trade Setup Plan
👇 Aggressive Entry (Riskier)
Sell Limit: 164.90
SL: 165.90
TP1: 160.00
TP2: 157.00
TP3 (optional): 155.00
Use this only if you want to catch the wick, but recognize the higher chance of being swept.
✅ Conservative Entry (Recommended)
Wait for a daily candle close under 162.00 after touching 164. That confirms rejection.
Entry: On next day’s minor retest (e.g., 162.50–163.00)
SL: 165.50 (above recent highs)
TP1: 160.00
TP2: 157.00
TP3: 155.00
Risk: 1–2% depending on confirmation strength
📌 Optional Breakout Plan (In case resistance breaks cleanly)
Buy Stop: 165.60
SL: 164.30
TP: 170.00 (weekly resistance)
Use only if a strong daily close above 165 confirms breakout.
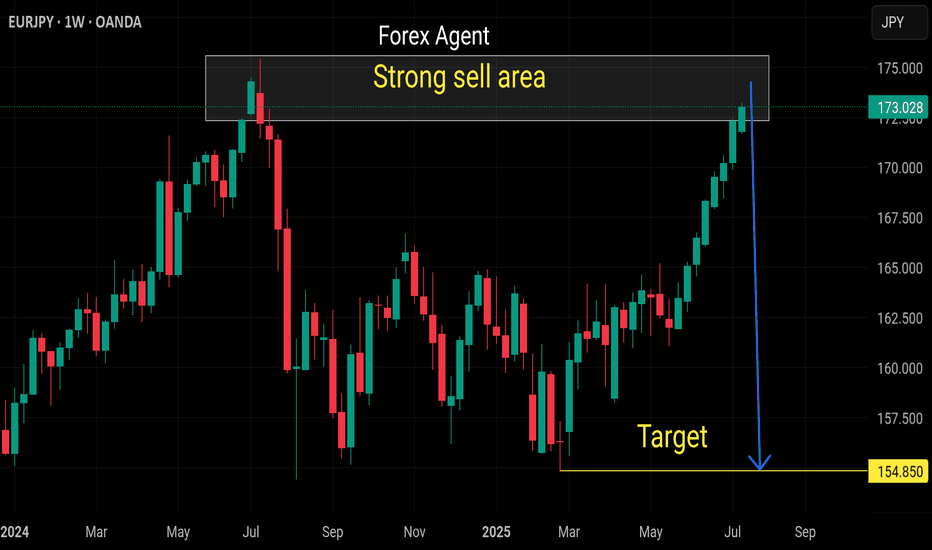
EURJPY: Bears Will Push
Remember that we can not, and should not impose our will on the market but rather listen to its whims and make profit by following it. And thus shall be done today on the EURJPY pair which is likely to be pushed down by the bears so we will sell!
Disclosure: I am part of Trade Nation's Influencer program and receive a monthly fee for using their TradingView charts in my analysis.
❤️ Please, support our work with like & comment! ❤️
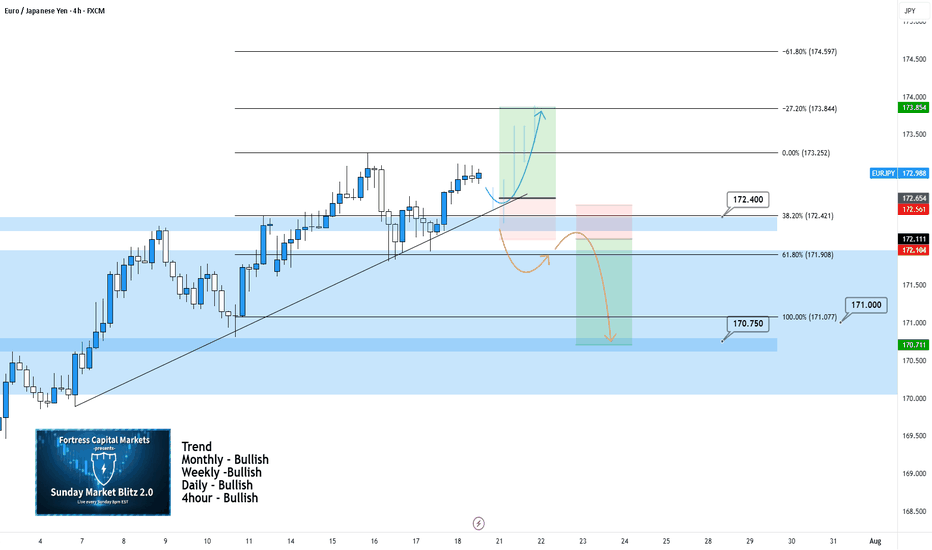
EURJPY My Opinion! BUY!
My dear subscribers,
My technical analysis for EURJPY is below:
The price is coiling around a solid key level - 160.44
Bias - Bullish
Technical Indicators: Pivot Points High anticipates a potential price reversal.
Super trend shows a clear buy, giving a perfect indicators' convergence.
Goal - 161.55
About Used Indicators:
By the very nature of the supertrend indicator, it offers firm support and resistance levels for traders to enter and exit trades. Additionally, it also provides signals for setting stop losses
Disclosure: I am part of Trade Nation's Influencer program and receive a monthly fee for using their TradingView charts in my analysis.
———————————
WISH YOU ALL LUCK
EURJPY- Buy on dips The EUR/JPY gained sharply on a strong Euro. It hit an intraday high of 162.69 and is currently trading around 162.39. The intraday outlook is bullish as long as the support 161.50 (200- 15 min EMA) holds.
In reply to the temporary halt by the U.S. government of a scheduled 20% tariff on European products in favor of a flat 10% tariff for three months (not including current tariffs on steel, aluminum, and automobiles), the EU has agreed to suspend its retaliatory tariffs against American products for 90 days to enable negotiations. The EU hopes to utilize this time to negotiate a full trade agreement, possibly with zero tariffs on manufactured goods, while planning internally to assist industries hit by tariffs and ensure equitable competition in the single market, as fears grow that rising tariffs could severely damage the EU economy and even lead to a recession.
Technical Analysis:
The EUR/JPY pair is trading above 34, below 55 EMA, and 200-4H EMA in the 15 min chart.
Near-Term Resistance: Around 163 a breakout here could lead to targets at 164.20/165/166.65/167.
Immediate Support: At 161.70 if breached, the pair could fall to 161/160.50/160/ 159.25/158.85/158.25.
Indicator Analysis 15 min chart):
CCI (50): Bullish
Average Directional Movement Index: Bullish
Overall, the indicators suggest bullish trend
Trading Recommendation:
It is good to buy on dips around 162.58-60 with stop loss at 161.50 for a TP of 164.20.
EurJpy Bullish Run to 166. - 167. Level Looking at the EJ chart i can see a potential move to 167. Daily FIB bullish move, Price created a nice support at 161. and a mayor level 160. where Both levels were broke and retested several times now this week, there is a mayor bearish trendline where price started to hesitate but price action is telling me it does not want to continue for a bearish move with all the wicks to 161. and 160. level specially after the last daily closure with a DOJI on the Moving Average, i do believe price is gonna start pushing to the upside, price tried to break structure at the 161. but immediately price faked out again breaking above the MAs. i would like to see Price start breaking intra day highs ( highs above 162.500 ) or a potential retest to 161. for an entry.
EUR/JPY Continues to Oscillate Within a Broad Sideways RangeThe euro has appreciated more than 1.5% against the Japanese yen over the last two sessions, and the growing bullish momentum in EUR/JPY has been driven mainly by renewed confidence in the euro following the recent weakness in the U.S. dollar. Additionally, the yen has come under downward pressure due to a reduction in safe-haven demand, prompted by Trump’s recent comments suggesting a pause in most tariffs targeting dozens of countries previously threatened in recent weeks. As the trade situation begins to stabilize, bullish pressure on EUR/JPY could become increasingly relevant in the short term.
Broad Sideways Range:
Since early August, a key sideways channel has taken shape, with resistance near 164.879 and support at 156.576. The price has tested both levels on multiple occasions but has so far failed to break out of this long-standing range. For now, this remains the most important technical formation to watch in upcoming trading sessions.
MACD:
The MACD histogram has approached the zero line and could be setting up for a bullish crossover, which may signal that the moving average momentum is starting to shift in favor of buying pressure. As the histogram moves further away from the neutral level, bullish momentum may gain even more significance on the chart.
TRIX:
The TRIX indicator line continues to oscillate above the zero line, indicating a prevailing bullish impulse. If the line continues to rise, this could lead to a stronger bullish momentum developing in the short term.
Key Levels:
164.879 – Upper Range Resistance: This level marks the top of the broad sideways channel and remains the most important resistance in the short term. Price action near this area may continue to reinforce bullish sentiment and could pave the way for a short-term uptrend.
160.655 – Near Support: A mid-range barrier that aligns with the 100-period simple moving average. Continued price action near this level may reinforce the current neutral range, keeping the existing structure intact.
156.576 – Major Support: This level corresponds to the lowest prices in recent months. A clear breakdown below this level could trigger a relevant bearish breakout, opening the door to a new downward trend.
By Julian Pineda, CFA – Market Analyst
EURJPY Short Term Buy Idea Update!!!Hi Traders, on March 27th I shared this idea "EURJPY - Expecting The Price To Bounce Higher Further"
Expected bullish continuation higher until the two Fibonacci support zones hold. You can read the full post using the link above.
Price is moving as per the plan!!!
Price respecting the second Fibonacci support zone and bounces higher. My bullish view still remains.
If you enjoy this idea, don’t forget to LIKE 👍, FOLLOW ✅, SHARE 🙌, and COMMENT ✍! Drop your thoughts and charts below to keep the discussion going. Your support helps keep this content free and reach more people! 🚀
--------------------------------------------------------------------------------------------------------------------
Disclosure: I am part of Trade Nation's Influencer program and receive a monthly fee for using their TradingView charts in my analysis.
EURJPY Will Go Down! Short!
Here is our detailed technical review for EURJPY.
Time Frame: 1h
Current Trend: Bearish
Sentiment: Overbought (based on 7-period RSI)
Forecast: Bearish
The market is trading around a solid horizontal structure 161.313.
The above observations make me that the market will inevitably achieve 160.605 level.
P.S
Please, note that an oversold/overbought condition can last for a long time, and therefore being oversold/overbought doesn't mean a price rally will come soon, or at all.
Disclosure: I am part of Trade Nation's Influencer program and receive a monthly fee for using their TradingView charts in my analysis.
Like and subscribe and comment my ideas if you enjoy them!
"EUR/JPY Trendline Break & RBR Zone Setup"🔹 Trendline Breakout
* ✍️ A descending trendline was clearly broken
* 📉 This signals a shift from bearish to bullish sentiment
* 🚀 Potential for a strong move upward
🔵 RBR Zone (Rally-Base-Rally)
* 📦 Marked as a demand zone
* 🧲 Price dipped into this zone and bounced — bullish sign!
* ✅ Ideal entry area for long trades
🎯 Target Point: 164.208
* 📈 This aligns with a previous swing high
* 🎯 Potential move: +309.8 pips / +1.92%
* 🥅 Clear bullish target if the momentum holds
🛑 Stop Loss: 160.455
* 🧱 Placed just below the demand zone
* 💡 Gives the trade breathing room
* 🔐 Risk-managed setup
📊 Indicators & Price Action
* 📍 Current Price: 161.443
* 📈 Above the DEMA (9) = Short-term bullish
* 🟢 Price action supports long entry
Summary
* 📌 Bias: Bullish
* 🎯 Target: 164.208
* 🛑 Stop: 160.455
* ⚖️ Risk-Reward: Excellent (R:R ≈ 1:3+)
Falling towards 61.8% Fibonacci support?EUR/JPY is falling towards the pivot which has been identified as a pullback support and could bounce tot he 1st resistance which acts as a pullback resistance.
Pivot; 160.52
1st Support: 159.67
1st Resistance: 162.16
Risk Warning:
Trading Forex and CFDs carries a high level of risk to your capital and you should only trade with money you can afford to lose. Trading Forex and CFDs may not be suitable for all investors, so please ensure that you fully understand the risks involved and seek independent advice if necessary.
Disclaimer:
The above opinions given constitute general market commentary, and do not constitute the opinion or advice of IC Markets or any form of personal or investment advice.
Any opinions, news, research, analyses, prices, other information, or links to third-party sites contained on this website are provided on an "as-is" basis, are intended only to be informative, is not an advice nor a recommendation, nor research, or a record of our trading prices, or an offer of, or solicitation for a transaction in any financial instrument and thus should not be treated as such. The information provided does not involve any specific investment objectives, financial situation and needs of any specific person who may receive it. Please be aware, that past performance is not a reliable indicator of future performance and/or results. Past Performance or Forward-looking scenarios based upon the reasonable beliefs of the third-party provider are not a guarantee of future performance. Actual results may differ materially from those anticipated in forward-looking or past performance statements. IC Markets makes no representation or warranty and assumes no liability as to the accuracy or completeness of the information provided, nor any loss arising from any investment based on a recommendation, forecast or any information supplied by any third-party.