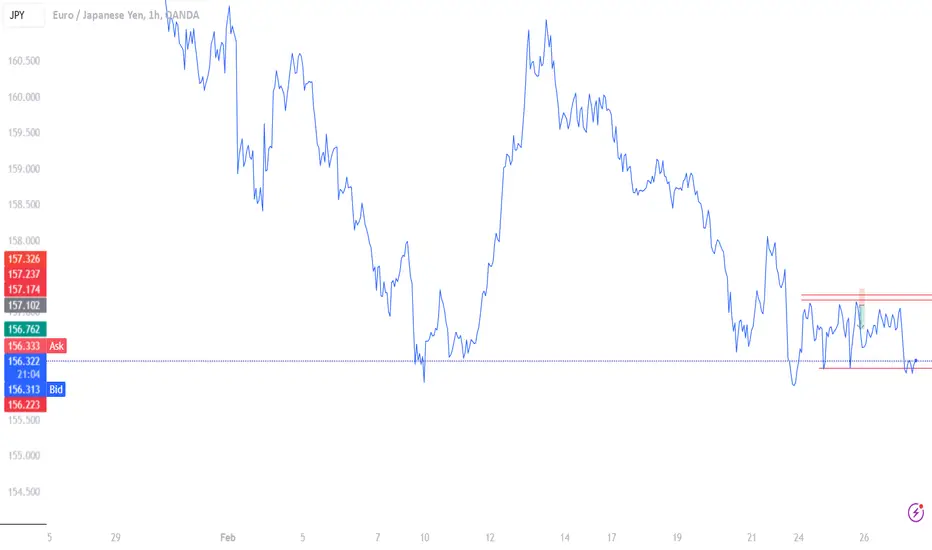
#036 Trust The Process EURJPY 0936SGT 27022025Buying.
Price at major support area, so, buy, right?
0927SGT 27022025
I have some ideas privated because i reached the daily limit for posting ideas.
I will repost them later. Now I feel giddy and trapped plus im so tired and malnourished.
Too bad. the effects of childhood trauma has caught up.
0938SGT 27022025
EURJPY trade ideas
EUR/JPY Key Supply Zone Holding – Bearish Rejection in PlayChart Analysis & Trade Setup:
The EUR/JPY 45-minute chart highlights a strong supply zone near 157.50 - 157.60, where price has repeatedly rejected, leading to multiple sell-offs. This zone remains a critical resistance area for further downside movement.
Technical Breakdown:
📌 Key Supply Zone (157.50 - 157.60): Price has attempted to break above but faced strong rejection, confirming sellers' dominance.
📉 Bearish Price Action: Each rejection from the supply zone has resulted in a decline towards key support levels.
🔄 Liquidity Grab & Drop: A fake-out above 157.50 led to a sharp reversal, suggesting a distribution phase.
Trade Plan:
✅ Entry: Consider a short position on a retest of 156.50 - 157.00, if price fails to reclaim higher levels.
🎯 Target 1: 156.00 (Recent support level).
🎯 Target 2: 155.70 - 155.50 (Stronger demand zone).
🛑 Stop Loss: Above 157.65, as a breakout above this level would invalidate the bearish setup.


EURJPY BUY PROJECTION As we can see price has taken out the sell side liquidity, and has a new low , so I expect price to go long.


eurjpy buy tradeThe Relative Strength Index (RSI) is showing an upward trend, indicating increasing momentum. Additionally, the Moving Average Convergence Divergence (MACD) is showing a bullish crossover, further supporting the potential for an upward move.

EURJPY 4h strong support zone EUR/JPY – 4H Chart Analysis (Feb 27, 2025)
1. Market Structure & Trend Analysis
The chart shows that EUR/JPY has broken out of a descending channel, indicating a potential bullish reversal.
A higher low formation could confirm the beginning of an uptrend.
The key resistance level to watch is 159.87, where the price could face selling pressure.
2. RSI & Momentum Analysis
RSI is currently at 51.89, signaling that momentum is shifting towards the bulls.
The previous downtrend showed oversold conditions, and now RSI is starting to rise, confirming a potential bullish move.
3. Key Levels to Watch
Support:
156.38 (Breakout retest zone; price must stay above this to remain bullish)
155.50 - 156.00 (Demand zone; if lost, downtrend may resume)
Resistance:
159.87 (Major resistance; could act as a take-profit zone for longs)
162.00 (Next resistance if the uptrend gains strength)
4. Potential Trade Scenarios
📈 Bullish Scenario (Higher Probability)
If price holds above 156.38 and continues its breakout move, a rally towards 159.87 is likely.
Long Setup:
Entry: Around 156.50 - 157.00
Stop-loss: Below 156.00
Target: 159.87
📉 Bearish Scenario (Low Probability)
If price fails to hold above 156.38, a drop back into the channel could happen.
A rejection at 159.87 could also trigger a retracement.
5. Conclusion & Strategy
Short-term bias: Bullish, targeting 159.87 if support at 156.38 holds.
Trade idea: Look for a pullback entry near support and ride the breakout move.
Risk management: Keep a tight stop below 156.00 to avoid false breakouts.


EUR-JPY Long From Support! Buy!
Hello,Traders!
EUR-JPY is trading in a
Strong downtrend but
A horizontal support
Level is ahead so after
A retest we will be expecting
A local bullish move up
Buy!
Comment and subscribe to help us grow!
Check out other forecasts below too!

EUR JPY BIG SELL COMING ?Eur jpy traveling between 154.5 and 163.5 area for quite some time. The daily price action is getting bearish whith the medium term trend line breaking and the recovery attempt failing.
If the supoort line located at 154.5 breaks, the pair can see a big drop to 150 level and lower .

EUR/JPY – High-Probability Short Setup 1️⃣ Market Overview – Bearish Bias Confirmation
EUR/JPY remains in a strong downtrend, forming lower highs and lower lows. Currently, the price is retracing into a critical Fibonacci resistance zone, making this a prime opportunity to short the pair in line with institutional sentiment and seasonality trends.
2️⃣ Fibonacci Levels – Identifying Key Resistance
The Fibonacci retracement is drawn from the most recent bearish impulse.
Resistance Zone: 0.5 (156.888) to 0.786 (157.107) – a high-probability rejection area.
If price fails to break above this zone, a continuation to the downside is expected.
Prime Seasonality Insights – Historical Data Supports the Short Bias
📊 Seasonality trends over 15 years indicate that EUR/JPY historically declines in late February and early March.
🔻 February seasonality performance: -0.7% average return
🔻 Next 3-5 day forecast: Bearish probabilities (-0.06% to -0.21%)
🔻 Seasonality prediction candles show a short-term retracement, followed by downside continuation.
💡 This aligns with the technical setup, reinforcing a short bias.
4️⃣ Retail Sentiment – Smart Money Edge
🚨 79% of retail traders are LONG on EUR/JPY – a contrarian signal for a short trade.
🔻 Institutions (Smart Money) are aggressively shorting EUR/JPY, as seen in COT data.
🔻 Commitment of Traders (COT) Report shows increased institutional short positioning.
🔻 Retail traders trapped in longs will likely get stopped out, fueling further downside.
5️⃣ Technical Confirmation – Trendline & Indicators
✅ Price is below all major EMAs (6, 24, 72, 288) on the 4-hour chart.
✅ Supertrend remains bearish on the 4-hour timeframe.
✅ A downward sloping trendline aligns with the Fibonacci resistance zone.
💡 I will wait for confirmation (rejection wick, bearish engulfing candle) before entering a short position.
6️⃣ Conclusion – Trade Plan for EUR/JPY
🔹 Bias: Bearish due to downtrend, Fibonacci resistance, seasonality, and institutional short positioning.
🔹 Trade Setup:
Sell EUR/JPY at 156.88 - 157.10 (Upon rejection)
Stop Loss: Above 157.26
Take Profit Targets: 156.30, 156.04, 156.00
🔹 Key Confirmation: Retail traders are trapped in longs, seasonality supports further downside, and institutions are short.
🚀 This is a prime example of how combining Seasonality, Smart Money Positioning, and Technicals can create a powerful trade setup.
📌 What’s your outlook on EUR/JPY? Let’s discuss in the comments!

EURJPY INTRADAY bearish below 158.50 The EURJPY price action sentiment appears bearish, supported by the longer-term prevailing downtrend.
The key trading level is at 158.50, the 03rd February swing low level and falling resistance trendline zone. An oversold rally from the current levels and a bearish rejection from the 158.50 level could target the downside support at 155.73 followed by 154.74 and 153.25 levels over the longer timeframe.
Alternatively, a confirmed breakout above 158.50 resistance and a daily close above that level would negate the bearish outlook opening the way for further rallies higher and a retest of 161.28 resistance followed by 162.74 levels.
This communication is for informational purposes only and should not be viewed as any form of recommendation as to a particular course of action or as investment advice. It is not intended as an offer or solicitation for the purchase or sale of any financial instrument or as an official confirmation of any transaction. Opinions, estimates and assumptions expressed herein are made as of the date of this communication and are subject to change without notice. This communication has been prepared based upon information, including market prices, data and other information, believed to be reliable; however, Trade Nation does not warrant its completeness or accuracy. All market prices and market data contained in or attached to this communication are indicative and subject to change without notice.

EURJPY Strong oversold buy opportunity.The EURJPY pair broke again below the 0.786 Fibonacci retracement level of its Rectangle pattern and is consolidating. Every time this break-out occurred, the price was a buy opportunity.
This time, the 1D RSI is on Higher Lows, i.e. a Bullish Divergence, which makes the opportunity even stronger. We are expecting a 1D MA200 (orange trend-line) test below the Lower Highs trend-line at 162.250.
-------------------------------------------------------------------------------
** Please LIKE 👍, FOLLOW ✅, SHARE 🙌 and COMMENT ✍ if you enjoy this idea! Also share your ideas and charts in the comments section below! This is best way to keep it relevant, support us, keep the content here free and allow the idea to reach as many people as possible. **
-------------------------------------------------------------------------------
💸💸💸💸💸💸
👇 👇 👇 👇 👇 👇

eurjpy buy signal. Don't forget about stop-loss.
Write in the comments all your questions and instruments analysis of which you want to see.
Friends, push the like button, write a comment, and share with your mates - that would be the best THANK YOU.
P.S. I personally will open entry if the price will show it according to my strategy.
Always make your analysis before a trade

Eurjpy Trade IdeaI managed to catch some solid shorts on EJ with price being in a range. Entry was a flip of structure & retest to confirm shorts for a range continuation. EJ had tapped and respected a major support at 157.736. With that being said in order for price to continue the higher time frame range I personally would want to see price break above and retest 157.200 for those longs. If that happens then longs would the priority on the pair.

#027 Trust The Process EURJPY Sell 2009SGT 25022025Selling EURJPY.
I have only a few things to say,
1st - I didn't go to work yesterday because I was so tired. I am always lethargic I think I am so weak.
2nd - I wanted to go work at 8pm, now is 8pm. But I think I need to drag to 9pm.
I ned to make some money to pay for living expenses and stuff. Even if I manage to be a successful trader, I will continue working.
Right now, I think I am sitting on -13R loss across 4 accounts, over 26 trades, open and closed.
2011SGT 25022025
Add : This EURJPY trade is based on 1 Minute Time Frame, and I took it originally for my Oanda mt4 accounts. Whenever possible and I have the energy and space to do those things, I will take trades as much as I could.
I think, blowing my accounts is my secret super power.
...2016SGT 25022025

Eur/Jpy Long swingOn longer timeframe I am looking for shorts on Eur/Jpy but in nearest time I expect some kind of pullback up to MA20 and possibly up to trendline seen on dailychart.
For entry look for confirmation in priceaction. It may take couple of days into next week to see what price wants to do. 154.500 is a good place to enter. If price falls straight through support than wait with pulling a trigger. In this case area under lows can be a good place for long entry. But it price struggles to move lower it's your sign to go long.
For target aim for MA20 around 158.500 on dailychart and if price looks to hold here expect more upside, up to current highs around 163.00
Stop-loss under major lows.

EUR/JPY Tests Key Support at 156.00 – Breakdown or Bounce?📉 EUR/JPY edges lower to 156.38 (-0.22%) as sellers pressure key support.
🔎 Technical Setup:
156.00 major horizontal support holding for now.
Bearish bias intact below 50-day EMA (160.08) & 200-day EMA (161.87).
Break below 156.00 could open downside toward 152.50-153.00.
📊 Momentum Indicators:
RSI at 36.62 → Not oversold yet, but approaching key levels.
MACD remains bearish, confirming ongoing downside pressure.
⚠️ Key Levels to Watch:
Bulls must defend 156.00 or risk further selling pressure.
A break & close below 156.00 could accelerate losses toward 152.50.
Bulls need a reclaim of 158.50-160.00 for trend reversal.
🚀 Decision point for EUR/JPY – will 156.00 hold?
📌 Watching daily close for confirmation.
- MW

Which pair to watch after Merz wins?The rise of the euro and German stocks reflects the market's response to Friedrich Merz's victory in the German legislative elections held on Sunday, February 23, 2025. This victory seems to herald a political shift towards increased government spending, bringing hope for boosting the struggling German economy. The euro experienced a notable recovery against the G10 currencies, rising by about 0.5% against the US dollar, supported by investor expectations that the new government will abandon the conservative financial approach.
Concurrently, the EUR/JPY pair appears poised for a short-term rise, reversing its previous downward trend to an upward one. Currently, this pair is trading at important support levels ranging between 156 and 156.7, enhancing the likelihood of continuing the upward trend and surpassing the recent corrective phase towards a target level of 159.832. It is important to note that this positive outlook will be invalidated if the price falls and closes daily below the 155.506 level.

EURJPY Will Go Higher From Support! Buy!
Take a look at our analysis for EURJPY.
Time Frame: 9h
Current Trend: Bullish
Sentiment: Oversold (based on 7-period RSI)
Forecast: Bullish
The market is testing a major horizontal structure 156.763.
Taking into consideration the structure & trend analysis, I believe that the market will reach 158.582 level soon.
P.S
Please, note that an oversold/overbought condition can last for a long time, and therefore being oversold/overbought doesn't mean a price rally will come soon, or at all.
Like and subscribe and comment my ideas if you enjoy them!

EURJPY H1 POTENTIAL BEARISHEUR/JPY is still showing a bearish trend on the higher timeframe, supported by resistance in the Fibonacci area.

Potential bullish rebound?EUR/JPY is reacting off the pivot and could rise to the 1st resistance which lines up with the 50% Fibonacci retracement.
Pivot: `155.94
1st Support: 153.99
1st Resistance: 158.57
Risk Warning:
Trading Forex and CFDs carries a high level of risk to your capital and you should only trade with money you can afford to lose. Trading Forex and CFDs may not be suitable for all investors, so please ensure that you fully understand the risks involved and seek independent advice if necessary.
Disclaimer:
The above opinions given constitute general market commentary, and do not constitute the opinion or advice of IC Markets or any form of personal or investment advice.
Any opinions, news, research, analyses, prices, other information, or links to third-party sites contained on this website are provided on an "as-is" basis, are intended only to be informative, is not an advice nor a recommendation, nor research, or a record of our trading prices, or an offer of, or solicitation for a transaction in any financial instrument and thus should not be treated as such. The information provided does not involve any specific investment objectives, financial situation and needs of any specific person who may receive it. Please be aware, that past performance is not a reliable indicator of future performance and/or results. Past Performance or Forward-looking scenarios based upon the reasonable beliefs of the third-party provider are not a guarantee of future performance. Actual results may differ materially from those anticipated in forward-looking or past performance statements. IC Markets makes no representation or warranty and assumes no liability as to the accuracy or completeness of the information provided, nor any loss arising from any investment based on a recommendation, forecast or any information supplied by any third-party.

EURJPY (LONG)
Support Level that has been holding for longest time.
At Pivot level for Bulls to enter.
JPY pairs all on support.
