$EJ (EURJPY) 1HPrice has been in an overall bullish structure, forming higher highs and higher lows.
Price tapped into a premium zone, showing signs of exhaustion.
After the liquidity run, we saw a rejection from the top, followed by a shift in structure.
A bearish FVG has formed, and price has now retraced back into it, offering a potential sell opportunity.
As long as price holds below the high and inside the premium FVG zone, bearish bias is valid. Any break above the recent high would invalidate this setup.
EURJPY trade ideas

EUR/JPY BEST PLACE TO SELL FROM|SHORT
Hello, Friends!
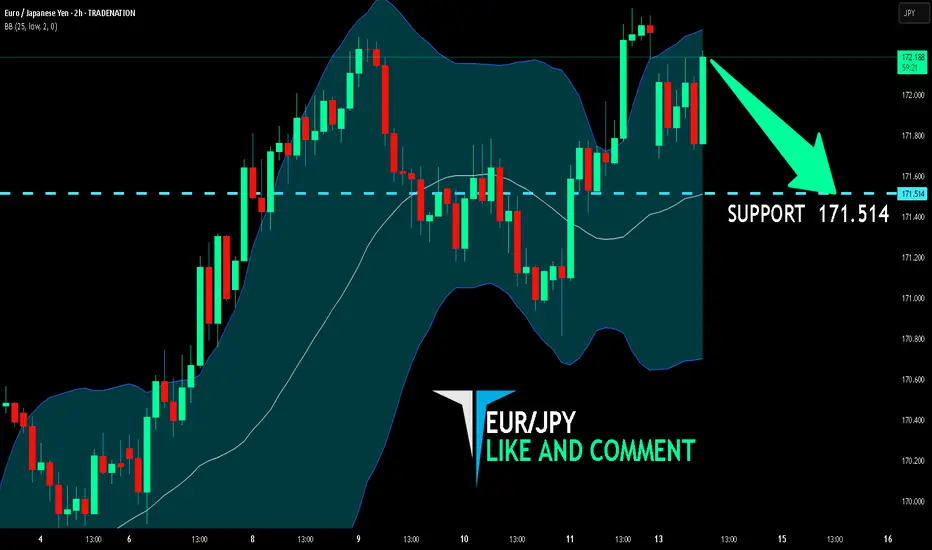
EUR/JPY pair is trading in a local uptrend which we know by looking at the previous 1W candle which is green. On the 2H timeframe the pair is going up too. The pair is overbought because the price is close to the upper band of the BB indicator. So we are looking to sell the pair with the upper BB line acting as resistance. The next target is 171.514 area.
Disclosure: I am part of Trade Nation's Influencer program and receive a monthly fee for using their TradingView charts in my analysis.
✅LIKE AND COMMENT MY IDEAS✅
EURJPY SHORT – DAILY FORECAST Q3 | W29 | D14 | Y25 GAP SHORT!!!!💼 EURJPY SHORT – DAILY FORECAST
Q3 | W29 | D14 | Y25
📊 MARKET STRUCTURE SNAPSHOT
EURJPY is currently reacting from a key higher time frame supply zone, with price action showing weakness at premium levels. Structure and momentum are now aligning for a short opportunity backed by multi-timeframe confluence.
🔍 Confluences to Watch 📝
✅ Daily Order Block (OB)
Strong reaction and early signs of distribution.
Previous bullish momentum is losing steam; structure is flattening with rejection wicks forming.
✅ 4H Order Block
Break of internal structure (iBoS) confirms a short-term bearish transition.
✅ 1H Order Block
1H structure shift bearish
📈 Risk Management Protocols
🔑 Core principles:
Max 1% risk per trade
Only execute at pre-identified levels
Use alerts, not emotion
Stick to your RR plan — minimum 1:2
🧠 You’re not paid for how many trades you take, you’re paid for how well you manage risk.
🧠 Weekly FRGNT Insight
"Trade what the market gives, not what your ego wants."
Stay mechanical. Stay focused. Let the probabilities work.
🏁 Final Thoughts from FRGNT
📌 The structure is clear.
The confluences are stacked.
Let execution follow discipline, not emotion.

EURJPY ANALYSIS After seeing the previous weekly candle close bullish and the past few weeks pushing to the upside we could expect the momentum to continue into weekly highs of 175.000

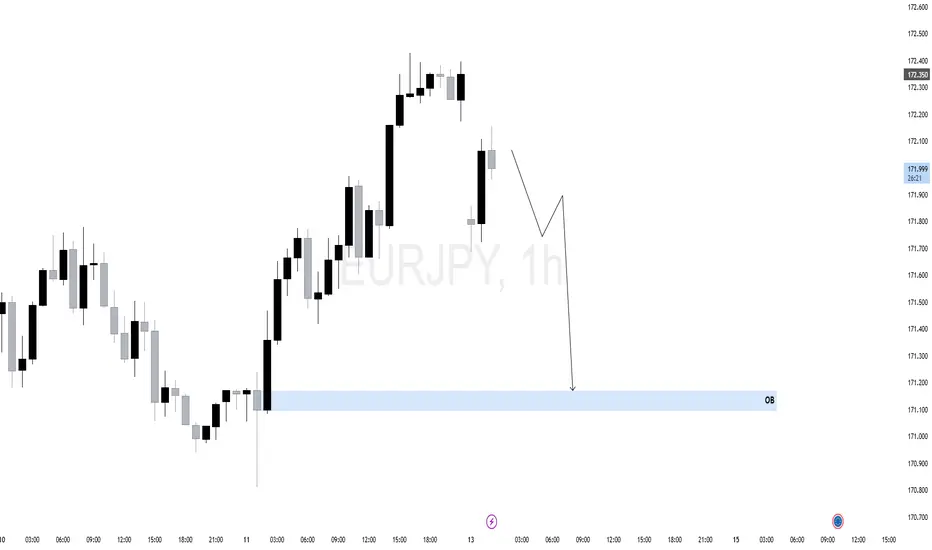
$EJ (EURJPY) 1HEURJPY recently showed a strong bullish rally off a key 1H Order Block (OB) near 171.200. This rally swept sell-side liquidity before shifting short-term structure.
However, current price action shows signs of weakness — multiple rejection wicks near 172.350 and a potential shift in momentum.
The corrective structure forming suggests the bullish move may have been a liquidity run. A clean lower high may confirm bearish intent.
As long as price remains below the recent swing high, we anticipate a short-term retracement toward the OB zone (171.200), which aligns with an area of unfilled orders and possible rebalancing.
EURJPY: Clean Rejection Off the 200 EMAPrice tapped the 200 EMA and held.
Structure still bullish, no reason to flip bias just yet.
Let’s see if buyers can take it from here — nothing forced, just flow.

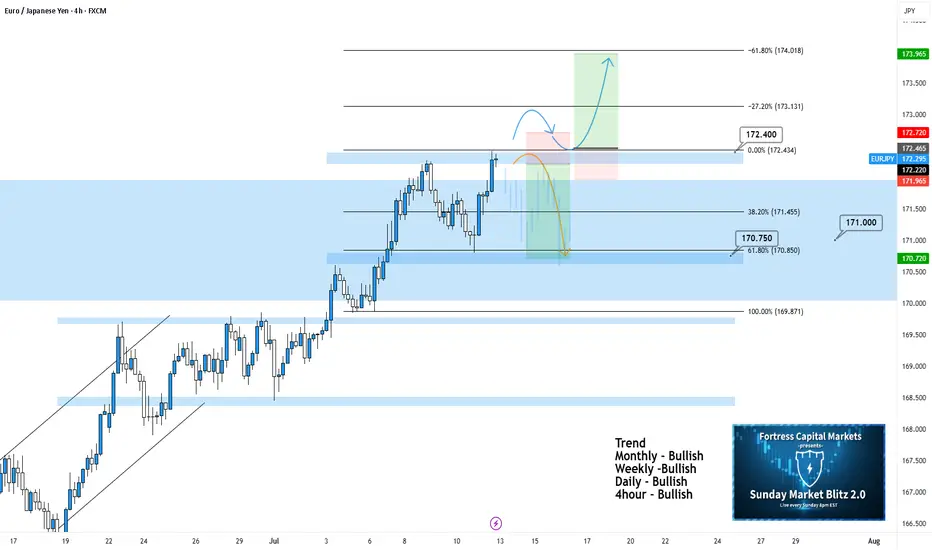
EURJPY 4hour TF - July 13th, 2025EURJPY 7/13/2025
EURJPY 4hour Bullish Idea
Monthly - Bullish
Weekly - Bullish
Daily - Bullish
4hour - Bullish
EJ has been paying out for the last couple weeks and the analysis has been spot on for these setups. Going into this week though we’re starting to get a bit uncertain. The fact that we’ve been in a rally since late June leaves me wondering how much more EJ has in it before a correction. So I think this week warrants some caution on EJ especially as we remain around this monthly 171.000 zone.
Let’s keep a look out for two potential scenarios going into this week:
Bullish Continuation - This is the most likely scenario and this idea lines up with all the major trends as well. For us to comfortably consider long setups I’d like to see a clear break above 172.400 zone / our 0% fib level followed by a retest for confirmation. This is what we would like to see but keep in mind price action has been moving aggressively and may not provide a retest.
Bearish Reversal into Range - This is a possibility but could also be a sign of consolidation around 171.000. There may be a decent short opportunity if we see the right kind of rejection/reversal from 172.400. In this scenario, it looks like this would be a potential range trade and I wouldn’t try to repeat this setup more than once.
EURJPY – Breakout Retest Trade | TCB Strategy ExecutionEURJPY – Breakout Retest Trade | TCB Strategy Execution
📍 Pair: EURJPY
🕒 Timeframe: 4H
📅 Date: July 13, 2025
📈 Strategy: TCBFlow (Trend → Countertrend → Breakout)
🔹 Market Context:
EURJPY is maintaining bullish structure within a rising trend channel. After a corrective dip, price has reclaimed structure above 171.550–171.640 and broken above resistance with momentum.
This move creates a potential retest buy opportunity, targeting the 174.00 region as part of a breakout continuation.
✅ TCB Breakdown:
Trend: Clear bullish channel holding
Countertrend: Short pullback into structure demand
Breakout: Price broke above minor resistance (171.640–172.338)
🎯 Trade Idea:
Buy Zone: 171.640–171.552 (retest of breakout)
SL: Below 171.20
TP Target: 174.000 zone (measured move + expansion target)
📊 Checklist Score: 90–95%
✅ Clean trend structure
✅ Valid countertrend breakout
✅ Momentum break with potential NY retest

EURJPY: Bullish Trend ContinuationPrice remains in a strong uptrend, now trading above the 172.00 psychological level, targeting new liquidity above.
D1 Key Levels:
Support: 170.50 – 171.00 (daily demand zone + origin of breakout)
Resistance: Hasn't found a ceiling yet. Next key levels are psychological round numbers (173.00, 174.00).
H4 Demand Zone (Pullback Area): 171.20 – 171.50
Watch for retracement into this zone for a high-probability buy setup.
H1 OB: 171.30 – 171.50 (clean mitigation zone)
Monitor M15 for bullish BOS after price taps into this zone for confirmation.
M15 Optimal Plan:
Wait for pullback into 171.30–171.50
Confirm entry with M15 bullish BOS + displacement
🟢Entry Zone: 171.30 – 171.50 (after confirmation)
SL: 170.90
TP1: 172.80
TP2: 173.50
TP3: 174.20
Breakout Alternative: If price rallies above 172.80 early in the week, look for a breakout entry on retest.
Invalidation: H4 closes below 170.50

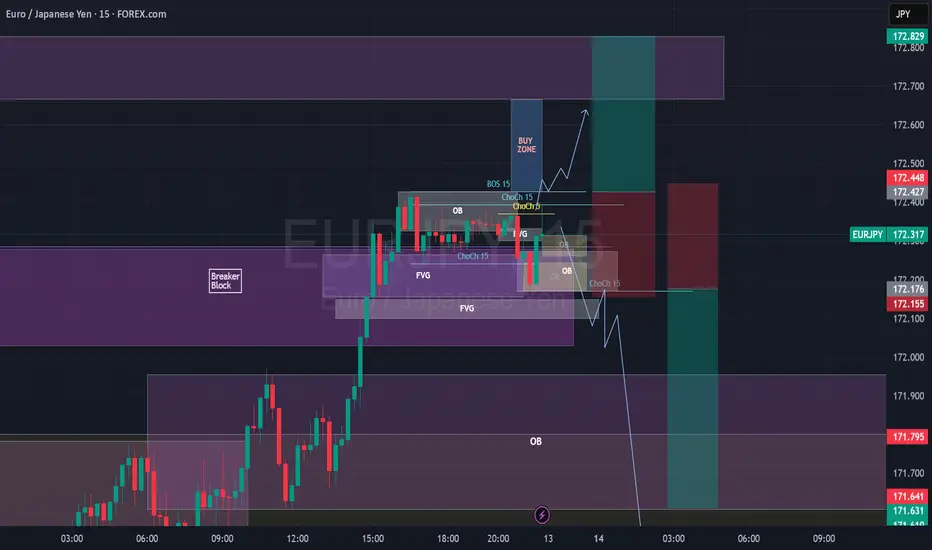
EURJPY Break of Structure, Retest and Fly5m - Monthly timeframes Bullish.
Price body candle closed and retested a 1H BB on 1H Timeframe.
Also retesting a 5M Bullish OB.
I want to wait for price to body candle close above the 15m BoS, create 3m/5m ChoCh, retest and look for Buys towards 172.665 (at the 1H OB or potentially 172.829, top of the 1H OB. SL under the 15m ChoCh.
EURJPY–trend continuation, engulfing candle .. the week of 14/07Friday’s candle engulfed 2 previous days of price action. I interpret this as strongly bullish, especially since this happened in an already nicely bullish trend. However, the room to the upside it not unlimited - the ATH is at 175.421. We are likely to see sideways price action there due to some profit taking and maybe even some selling. IMO there are 2 possible options to get a 2R return:
- we may get a pullback before the bullish trend resumes.
- we drop down to the H1 chart and look for an opportunity to go long.
Either way, in my opinion, the trade should be closed before the ATH.
This is not a trade recommendation; it’s merely my own analysis. Trading carries a high level of risk so carefully managing your capital and risk is important. If you like my idea, please give a “boost” and follow me to get even more.

Potential Short Opportunity on EURJPYReasons I think this pair will fall:
- Confirmed Trend line means harder break out.
- RSI was overbought on the 4H time frame
- Potential double top
What do you think?

EURJPY SHORT – WEEKLY FORECAST Q3 | W29 | Y25💼 EURJPY SHORT – WEEKLY FORECAST
Q3 | W29 | Y25
📊 MARKET STRUCTURE SNAPSHOT
EURJPY is currently reacting from a key higher time frame supply zone, with price action showing weakness at premium levels. Structure and momentum are now aligning for a short opportunity backed by multi-timeframe confluence.
🔍 Confluences to Watch 📝
✅ Daily Order Block (OB)
Strong reaction and early signs of distribution.
Previous bullish momentum is losing steam; structure is flattening with rejection wicks forming.
✅ 4H Order Block
Break of internal structure (iBoS) confirms a short-term bearish transition.
✅ 1H Order Block
1H structure shift bearish
📈 Risk Management Protocols
🔑 Core principles:
Max 1% risk per trade
Only execute at pre-identified levels
Use alerts, not emotion
Stick to your RR plan — minimum 1:2
🧠 You’re not paid for how many trades you take, you’re paid for how well you manage risk.
🧠 Weekly FRGNT Insight
"Trade what the market gives, not what your ego wants."
Stay mechanical. Stay focused. Let the probabilities work.
🏁 Final Thoughts from FRGNT
📌 The structure is clear.
The confluences are stacked.
Let execution follow discipline, not emotion.

EURJPY Hits Supply | Pullback Is ComingPrice has entered the daily supply zone (red area) between 170.80 and 171.80, showing immediate rejection with a long upper wick — a signal of potential short-term bearish reaction.
The RSI is turning lower, indicating loss of momentum, although it hasn’t reached extreme levels yet.
The current map suggests a technical pullback toward the 169.40–168.50 zone (FVG + dynamic support) before any potential bullish continuation toward 174+.
The overall structure remains bullish, but a correction looks likely due to technical exhaustion and retail positioning.
📊 2. COT Report (JPY Futures – as of 2025-07-01)
Non-Commercials (speculators) reduced long positions on the JPY by -7,779 contracts, and also slightly trimmed shorts → clear sign of position reduction.
Net positioning remains strongly negative (JPY weakness), but it's starting to recover slightly.
Commercials added both longs (+2,830) and shorts (+5,977), indicating indecision but growing interest.
Open interest slightly decreased (–516), though it remains elevated.
👉 The market has not yet reversed, but the JPY downtrend may be approaching exhaustion.
🧠 3. Retail Sentiment
86% of retail traders are short EUR/JPY — a strong contrarian bullish signal.
Average retail short entry: 166.27, while current price is 171.55 → retail traders are trapped and under pressure.
A short squeeze is likely underway or already completed, increasing the risk of a technical correction after distribution.
📅 4. Seasonality
July is historically weak for EUR/JPY:
20Y: -0.35
15Y: -0.49
10Y: -0.18
August tends to be even worse from a seasonal perspective.
This supports the idea of a potential pullback in the coming days or weeks.
Trading Conclusion
Current Bias: Short-term Neutral–Bearish, Medium-term Bullish.
✳️ Potential pullback from 172.30 toward 169.40–168.50
🎯 If price holds and builds clean bullish structure, expect continuation toward 174.00–175.00
❌ Invalidation on daily close below 167.80

EURJPY Long Trade There is an order block that started the long ride up, the ride up broke the previous Higher high.
It is expected that it come back to retest the order block, if this happen it will give up opportunity to go long

EURJPY - NEW BREAKOUT !Hello Traders !
After a huge bullish move,
The EURJPY broke the resistance level (170.639 - 171.605).
This key level becomes new support!
So, I expect a new bullish move🚀
_____________
TARGET: 173.530🎯

EUR-JPY Will Keep Growing! Buy!
Hello,Traders!
EUR-JPY is trading in an
Uptrend and the pair already
Made a bullish rebound from
The rising support so we are
Bullish biased and we will
Be expecting a further
Bullish move up
Buy!
Comment and subscribe to help us grow!
Check out other forecasts below too!
Disclosure: I am part of Trade Nation's Influencer program and receive a monthly fee for using their TradingView charts in my analysis.


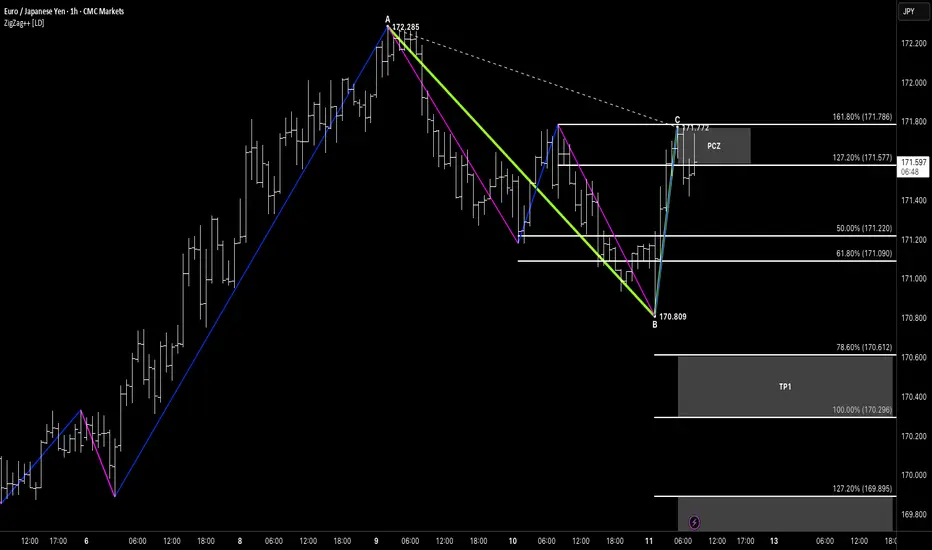
ABCHello traders! Happy Friday — hope you're closing the week strong.
Let’s break down this clean ABC Bearish pattern on EURJPY from the 1H chart.
📍 Structure Breakdown
We’re looking at a sharp A to B decline followed by a corrective rally into point C.
Point C completes just under the previous swing high, creating a potential lower high setup.
Price has reacted from this level and is now pushing lower, confirming bearish momentum.
🎯 Target Zones
We’ve projected the AB leg from point C to define a measured move:
TP1: 170.29 (100%)
TP2: 169.89 (127.2%)
Final extension at 169.38 (161.8%) offers additional confluence
Note how the TP1 zone aligns with prior structure levels and the 78.6% extension — offering a clean reaction area.
🧠 Pattern Notes
ABC symmetry-based projection
Bearish impulse > corrective rally structure
Potential for deeper extension if TP1 breaks
Beautiful example of structure-followed geometry
EUR/JPY ready to confirm the biggest trend change in many yearsEven though I post Chart patterns that have finished or are almost finished, let met share with you an unfolding pattern in EUR/JPY so you can easily follow it.
EUR/JPY has been rallying lately after a sharp decline this summer and this is forming a HEAD AND SHOULDERS pattern.
This kind of patterns work over 90% of the time and the returns in the first 20 days are usually over 10% with a minimal risk.
After the break of the previous bull trendline, EUR/JPY is in a neutral market so it's not time to short yet.
How to trade it?
The easiest way to trade it is by selling if the price breaks the blue support line, around the 158 area . This gives you the potential to move to 140 area, where:
1. You can win 8% in few days without leverage.
2. You just need to risk around 1,5% by using a tight stop loss.
So the profit will outweigh the risk by 5 times.
The risk management trick
Instead of investing everything in the previous idea, you could:
1. Invest 50% with a take profits at the 150 target. This is over 2% returns.
2. Keep investing 50% for an 8% return.
When the first TP occurs, you earn more than what you owe for the stop loss of the second position, meaning you have a now a sure trade whatever happens to the other 50%.
You keep risking 2% but you lock in profits as soon as the price touches 150.

EURJPY SHORT DAILY FORECAST Q3 D11 W28 Y25EURJPY SHORT DAILY FORECAST Q3 D11 W28 Y25
It’s Fun Coupon Friday! 💸🔥
Professional Risk Managers👋
Welcome back to another FRGNT chart update📈
Diving into some Forex setups using predominantly higher time frame order blocks alongside confirmation breaks of structure.
Let’s see what price action is telling us today! 👀
💡Here are some trade confluences📝
✅Daily Order block identified
✅4H Order Block identified
✅1H Order Block identified
🔑 Remember, to participate in trading comes always with a degree of risk, therefore as professional risk managers it remains vital that we stick to our risk management plan as well as our trading strategies.
📈The rest, we leave to the balance of probabilities.
💡Fail to plan. Plan to fail.
🏆It has always been that simple.
❤️Good luck with your trading journey, I shall see you at the very top.
🎯Trade consistent, FRGNT X

EURJPY – Buy the Dip in a Continuing UptrendTrade Idea
Type: Buy Limit
Entry: 171.00
Target: 172.50
Stop Loss: 170.25
Duration: Intraday
Expires: 11/07/2025 06:00
Technical Overview
The primary trend remains bullish, with no clear signs that the upward move is ending.
While a correction is possible, it is expected to be contained within the broader uptrend, providing an opportunity to buy at lower levels.
A move above 172.00 will confirm renewed bullish momentum, supporting a move toward 172.50, with a measured move target at 172.75.
Current levels do not offer a good risk/reward for immediate buying, so waiting for a dip to 171.00 is preferred.
No significant economic events are scheduled in the next 24 hours, keeping the focus on technical factors.
Key Technical Levels
Support: 172.00 / 171.50 / 171.00
Resistance: 172.00 / 172.50 / 172.75
Disclosure: I am part of Trade Nation's Influencer program and receive a monthly fee for using their TradingView charts in my analysis.

