EURJPY SHORT DAILY FORECAST Q3 D10 W28 Y25EURJPY SHORT DAILY FORECAST Q3 D10 W28 Y25
Professional Risk Managers👋
Welcome back to another FRGNT chart update📈
Diving into some Forex setups using predominantly higher time frame order blocks alongside confirmation breaks of structure.
Let’s see what price action is telling us today! 👀
💡Here are some trade confluences📝
✅Daily Order block identified
✅4H Order Block identified
✅1H Order Block identified
🔑 Remember, to participate in trading comes always with a degree of risk, therefore as professional risk managers it remains vital that we stick to our risk management plan as well as our trading strategies.
📈The rest, we leave to the balance of probabilities.
💡Fail to plan. Plan to fail.
🏆It has always been that simple.
❤️Good luck with your trading journey, I shall see you at the very top.
🎯Trade consistent, FRGNT X
EURJPY trade ideas

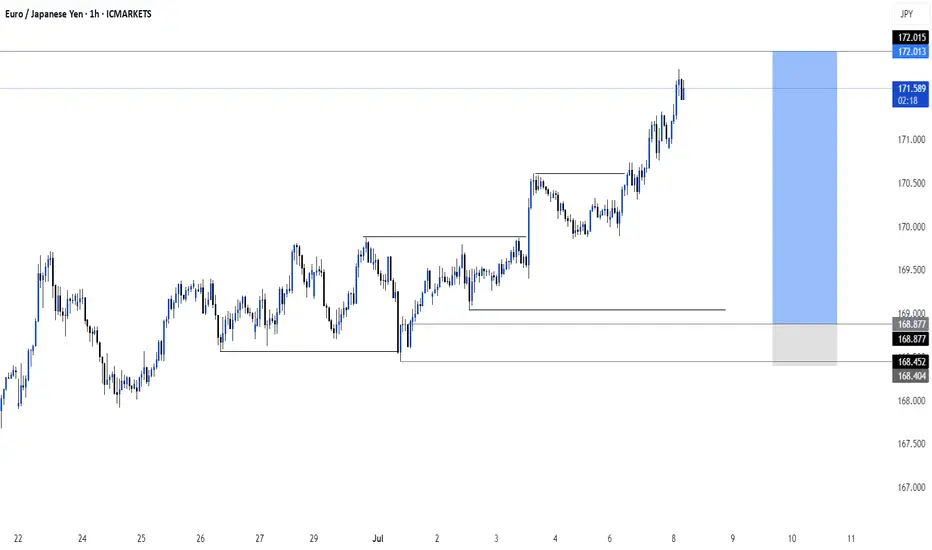
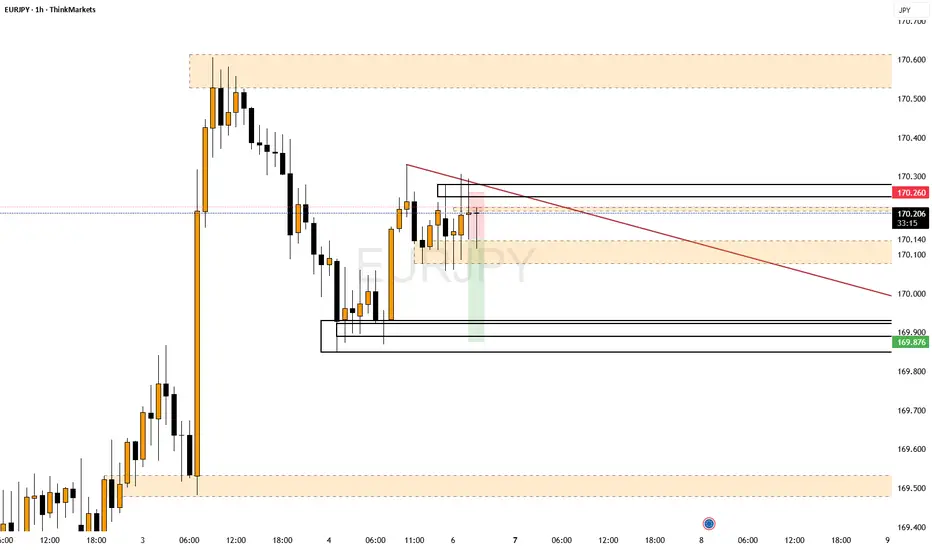
EURJPY Potential Sell ZoneI've set 2 pending limit orders here. One for the 1:1 RR and the other for a 1:4.3 RR. If the first trade holds we get a free shot at the 1:4 RR. NFA. Manage your risk accordingly. Sometimes I'll move to BE on trade 2 once we clear 1:2 RR.


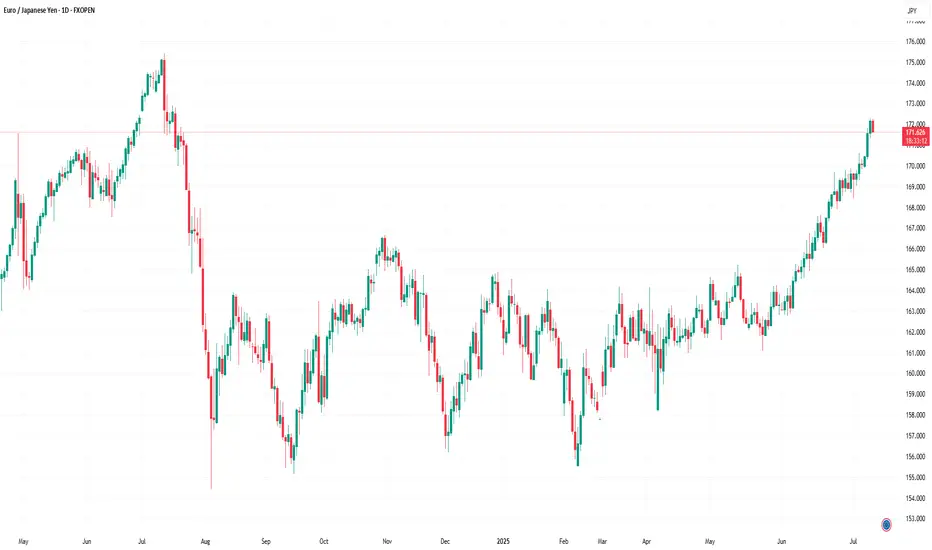
EUR/JPY Hits 12-Month HighEUR/JPY Hits 12-Month High
As the chart indicates, the EUR/JPY pair has risen above ¥172 per euro — a level last seen in July 2024.
Since early June, the exchange rate has increased by approximately 5.6%. This upward movement is driven by a combination of factors, including:
→ Divergence in central bank policy: The European Central Bank’s key interest rate remains significantly higher than that of the Bank of Japan, making the euro more attractive in terms of yield compared to the yen.
→ US trade tariffs on Japan: The potential imposition of 25% tariffs by the United States on Japanese goods poses a threat to Japan’s export-driven economy, placing downward pressure on the national currency.
→ Eurozone expansion and consolidation: News of Bulgaria’s potential accession to the euro area is strengthening investor confidence in the single currency.
→ Weakness in the US dollar: As the US Dollar Index fell to its lowest level since early 2022 this July, demand for the euro has grown, positioning it as a key alternative reserve currency.
Can the rally continue?
Technical Analysis of EUR/JPY
For several months, the pair traded within a range of approximately ¥156–165 per euro, but has recently broken above the upper boundary of this channel. Based on technical analysis, the width of the previous range implies a potential price target in the region of ¥174 per euro.
It is noteworthy that the rally gained momentum (as indicated by the arrow) following the breakout above the psychological threshold of 170, a sign of bullish market dominance. At the same time, the RSI has surged to a multi-month high, signalling moderate overbought conditions.
Under these circumstances, the market may be vulnerable to a short-term correction, potentially:
→ Towards the lower boundary of the ascending channel (shown in orange);
→ To retest the psychological support around ¥170.
That said, a reversal of the prevailing trend would likely require a significant shift in the fundamental backdrop — for example, progress towards a trade agreement between Japan and the United States.
This article represents the opinion of the Companies operating under the FXOpen brand only. It is not to be construed as an offer, solicitation, or recommendation with respect to products and services provided by the Companies operating under the FXOpen brand, nor is it to be considered financial advice.
EUR JPY has reached a resistance area and more likely to go downEURJPY has good rally recently and crossed fib 0.5 and now looks to be facing resistance at a trendline which was support earlier, on 4 hr chart look for breakout of this trendline and enter the trade.

EUR/JPY buy opportunity!!!Eurjpy provides us with a possible buy opportunity around 170.544 (pullback support) a retrace to that zone provides a potential buy opportunity. Keep a close a watch to take advantage of this opportunity


EURJPY Bullish Breakout!
HI,Traders !
#EURJPY is trading in an
Uptrend an the pair made a
Bullish breakout of the key
Horizontal level of 169.790
Which is confirmed so after
pullback we will
Be expecting a further
Bullish continuation !
Comment and subscribe to help us grow !

Bullish trade idea for EUR/JPYBullish trade idea for EUR/JPY:
Buy near 171.15
Take Profit at 171.78
Stop Loss below 171.10
Risk Management is important

EURJPY: Another Bullish pattern pushing EURJPY to 173 EURJPY: Another Bullish pattern pushing EURJPY to 173
Yesterday, EURJPY confirmed a bullish triangle pattern during the opening of the U.S. market.
EURJPY has already reached 170.60 and is coming back for a retest of the broken resistance before moving higher again.
It's a complex situation, but if the price holds above the 169.75 pattern, the chances of a clear uptrend will increase further.
Remember that the larger pattern will be almost complete near 173.00.
You may find more details in the chart!
Thank you and Good Luck!
PS: Please support with a like or comment if you find this analysis useful for your trading day
Disclosure: I am part of Trade Nation's Influencer program and receive a monthly fee for using their TradingView charts in my analysis.

EUR/JPY: Healthy Correction Expected Before the Next Leg UpWelcome back! Let me know your thoughts in the comments!
** EURJPY Analysis !
We recommend that you keep this pair on your watchlist and enter when the entry criteria of your strategy is met.
Please support this idea with a LIKE and COMMENT if you find it useful and Click "Follow" on our profile if you'd like these trade ideas delivered straight to your email in the future.
Thanks for your continued support! Welcome back! Let me know your thoughts in the comments!

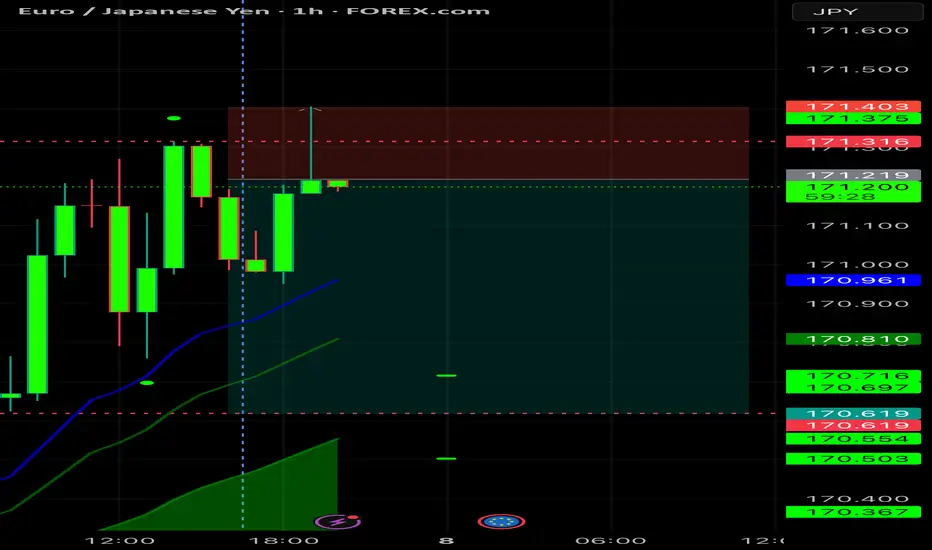
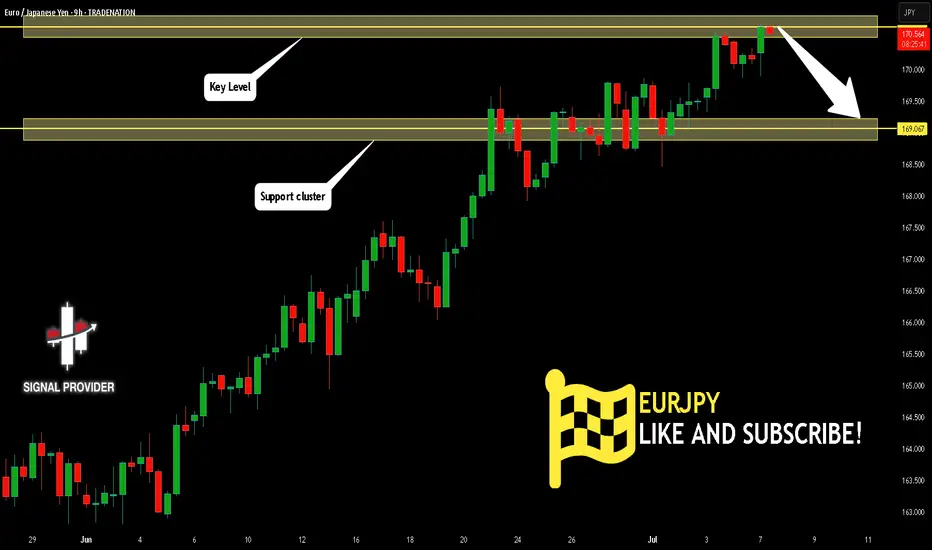
EURJPY Will Go Lower! Sell!
Please, check our technical outlook for EURJPY.
Time Frame: 9h
Current Trend: Bearish
Sentiment: Overbought (based on 7-period RSI)
Forecast: Bearish
The price is testing a key resistance 170.636.
Taking into consideration the current market trend & overbought RSI, chances will be high to see a bearish movement to the downside at least to 169.067 level.
P.S
We determine oversold/overbought condition with RSI indicator.
When it drops below 30 - the market is considered to be oversold.
When it bounces above 70 - the market is considered to be overbought.
Disclosure: I am part of Trade Nation's Influencer program and receive a monthly fee for using their TradingView charts in my analysis.
Like and subscribe and comment my ideas if you enjoy them!
EURJPYon the 5m timeframe, Price has reached a Short/Long Term true average. Also the overall market P.O.C its ranging in the lower timeframe supply wicks
EURJPY TRADE SETUPMarket trend is up also broken this recent ranging zone and retested so i hope this week price is continue to up so let's see what happenned guys

EURJPY 4Hour TF - July 6th, 2025EURJPY 7/6/2025
EURJPY 4hour Bullish Idea
Monthly - Bullish
Weekly - Bullish
Daily - Bullish
4hour - Bullish
EJ is doing it’s thing and sticking with it’s bullish trend for now. The only conflicting signal is this major monthly zone around the 171.000 area so we will have to be careful.
Let’s keep a look out for two potential scenarios going into this week:
Bullish Continuation - We just saw a break above the 169.750 4hour zone which is fairly significant and it is signaling new support for this currently forming higher low, which is great. From here we’re looking for this bullish trend to continue, look for strong bullish conviction coming off this 169.750 zone and look to target higher.
Trend Reversal - This is a possibility with our 171.000 looming overhead. If we start to see bearish rejection look for a lower high below 169.750 and look to target lower toward key support levels.

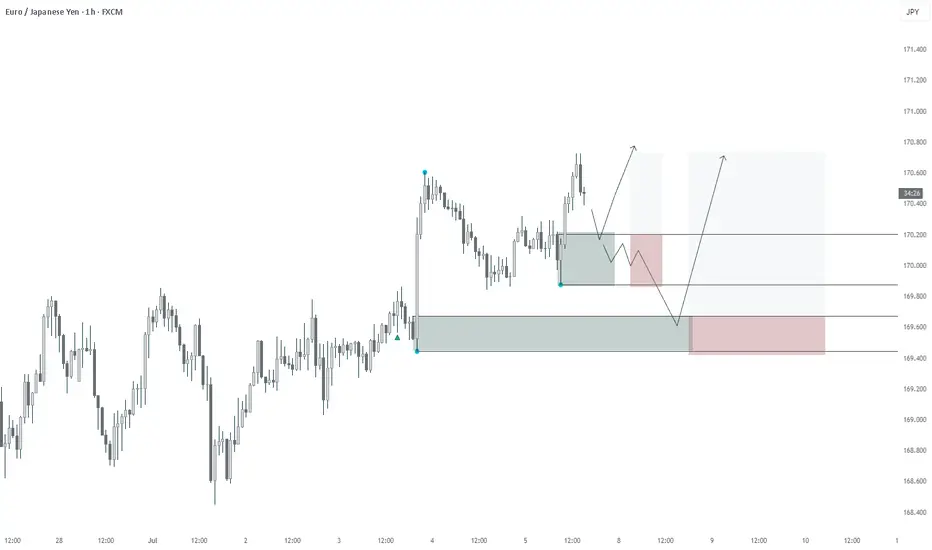
EURJPY: Trading Above Major QP 170. Strong Bullish Trend EJ broke above the key psychological level of 170.00, and has not found major resistance yet. Expecting a bullish trend continuation as long as price stays above 169.
* M30 Bullish Choch
* Creating new HHs and HLs
* M30/H1 Bearish Break Block
* M30/H1 Bullish FVG (50% filled)
🟢Entry: 168.40 – 168.60
Stop Loss: 168.00
TP1: 169.80
TP2: 170.50
TP3: 171.20
Breakout Option: If price pushes above 170.50 early in the week, consider breakout entry on retest.
Invalidation: Bias shifts to neutral if H4 closes below 169.00.

Downward move from resistance levelThe price of EURJPY is moving towards the resistance level on the H-4 timeframe and it is expected that the market will go downtrend after reaching the resistance level.

EURJPY: Bullish Outlook Explained 🇪🇺🇯🇵
There is a high chance that EURJPY will continue rising
from an underlined horizontal support.
I see 2 strong price action confirmations:
the price violated a resistance line of a bullish flag
and a neckline of a double bottom pattern.
Goal - 170.4
❤️Please, support my work with like, thank you!❤️
I am part of Trade Nation's Influencer program and receive a monthly fee for using their TradingView charts in my analysis.

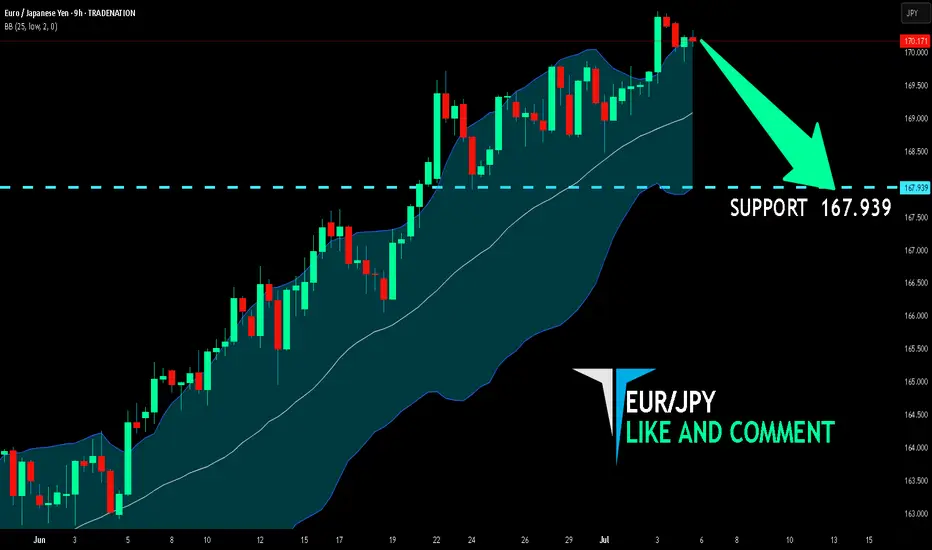
EUR/JPY BEARISH BIAS RIGHT NOW| SHORT
Hello, Friends!
We are now examining the EUR/JPY pair and we can see that the pair is going up locally while also being in a uptrend on the 1W TF. But there is also a powerful signal from the BB upper band being nearby, indicating that the pair is overbought so we can go short from the resistance line above and a target at 167.939 level.
Disclosure: I am part of Trade Nation's Influencer program and receive a monthly fee for using their TradingView charts in my analysis.
✅LIKE AND COMMENT MY IDEAS✅
EUR_JPY WILL GO UP|LONG|
✅EUR_JPY is trading in an
Uptrend and the pair has already
Made a retest of the horizotnal
Support of 169.800 and we are
Already seeing a bullish rebound
So we are bullish biased and
We will be expecting a
Further bullish move up
LONG🚀
✅Like and subscribe to never miss a new idea!✅
Disclosure: I am part of Trade Nation's Influencer program and receive a monthly fee for using their TradingView charts in my analysis.
