EURNOK, LONG POSITIONLadies and gentlemen, boys and girls.
Hereby you find my analysis for EURNOK.
Those currencies (EURNOK) aren't that easy to trade in, but finally I could make something of it.
I chose LONG POSITION because I saw a bullish three-drives pattern. I know you're asking yourself "Where is that pattern?"
It's too small and invisible to see but if you take a close look at it, you will definitely notice it.
Bear in mind that you won't make a lot of profit, but as one says "It's better to have something than nothing".
Share your opinions with me and let's make FOREX great again (I hope you see the reference)
EURNOK trade ideas

Adding to our EUR/NOK ShortGood Morning,
Oil is breaking higher closing above the 50 day exponential moving average (EMA) for the first time since October when it made 4 year highs. This should support long NOK and CAD positions. Looking to add to our short EURNOK positions on retracements towards 9.8000.
short EURNOK on continued poor EUR growth Trade we have had on for a while- continue to like short EURNOK on poor EUR growth and interest rate differentiation vs Norway. Highlighted two declining trendlines as well as Fibonacci support areas that we are currently trading around.
Head and shoulder pattern with right, declining leaning shoulder highlighted by the trendline.


eurnok shorteurnok break the support zone, next target: 9.64
possible the price drop to next target support zone: 9.44

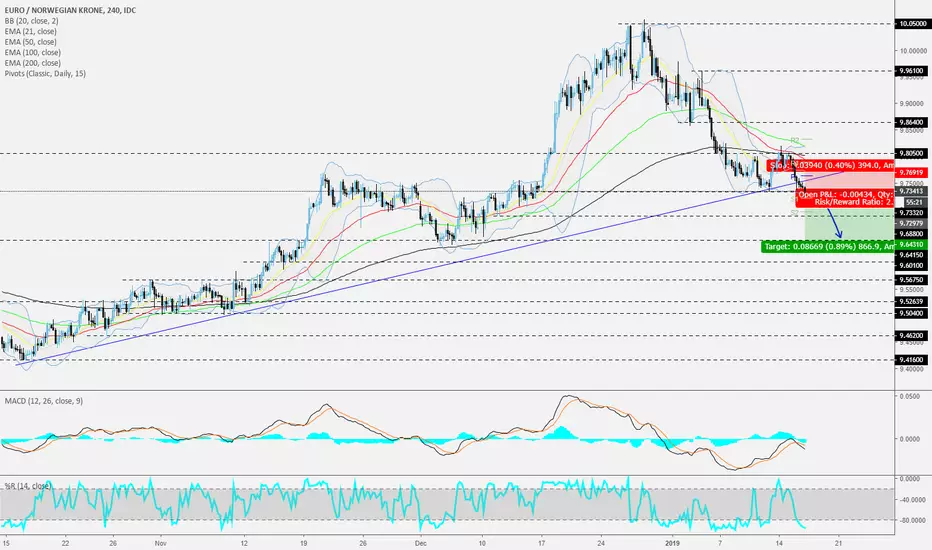
EURNOK - 240 - Breaking the the upside support lineTrade Alert
EURNOK has broken the medium-term upside support line, drawn from the low of October last year, and is now also testing the key support area, near the 9.7332. Such a setup favors the bears more than the bulls, which means we might see a follow through to the downside. For now, we will target slightly lower levels, as the euro is currently feeling a bit on the weak side.
That said, given the proximity of the rate to the upside support line, we will still keep in mind the possibility for a strong reversal back above the upside support line. And if that happens, we might abandon the above-mentioned bullish scenario.
Please see the chart for details.
Don't forget your SL.


EURNOK Buy signal on bullish Head and ShouldersPattern: 1D Head and Shoulders on a positive gradient.
Signal: Long on the formation of the right shoulder.
Target: 9.95100 the neckline's high.

EURNOK crossroad setup - breakout or fake outThe EURNOK has completed a Donchian shift from the lower to the upper channel.
The price is breaking out of the 9.81 resistance as well as of typing this. HOWEVER, the breakout will only be confirmed with a successful close outside of the level.
The 150 SMA is waiting for the price just a few points higher.
If the breakout succeeds and if the price can stick to the outer Donchian channel, we might see the origin of a new trend emerging.
Still a while to go for the potential breakout and if the price turns around, we might face a range bound market for a while. The EUR is not particularly strong as of now either.

EUR/NOK 1DMarket will test at fib level (0.2363).
After that we will go short at our first support zone.
- i use this for my own purpose-


EUR/NOK Short Idea Price respected trend line, and reached oversold territory. Impulsive move to the downside has happened. Expecting pullback before price drop to 50% or 61.8% fib level. Trade at your own risk.

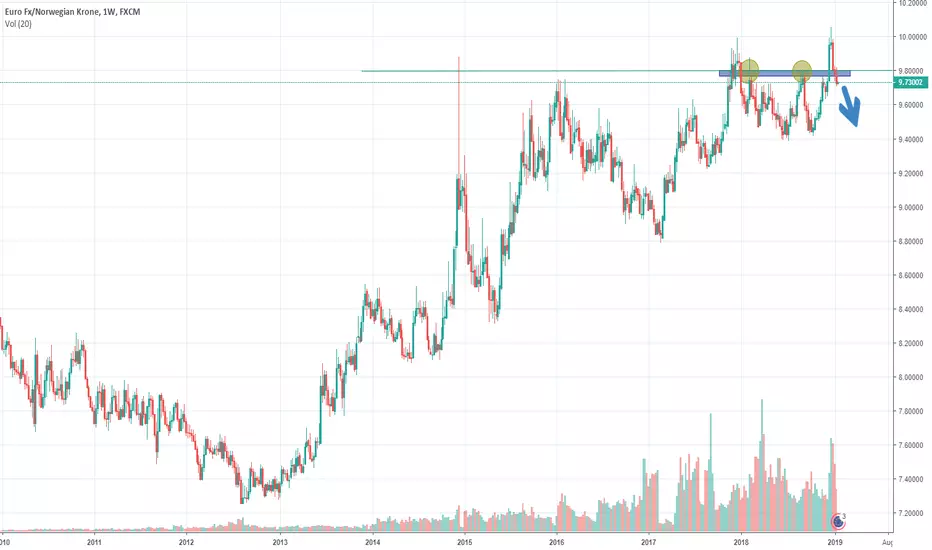
EUR/NOK 10 Year Resistance Level - Potential Reversal Hi, I shorted EUR/NOK at the 10 year Resistance level from 2008-2018
Weekly Pin Bar and at the Upper BB. The price was rejected.
Stoploss would be above 10.06
I am holding long term short as long as it goes down.

EURNOK AssessmentShort opportunity emerges as EURNOK reaches the tip of an ascending wedge on the weekly chart.

EUR/NOK : Trade Setup !!EUR/NOK , SELL at Current Price or After Breakdown .
You Can Also Set own Risk Reward ratio .
Let see what Will be Next Move.
Warning- I m Not a Financial Advisor this idea Only For Educational Purpose Only.
Thank You !!

You'll Love this EURNOK short... Testing Monthly Supply ZoneThis thing is going to drop. This is a basic S&R trade here. No brainer.

Watch for reversal signs on lower time frame and SELLEURNOK underpinned by rising wedge on weekly chat. Big fall ahead through 2019

