EURNOK trade ideas

EURNOK Next Big MoveLong Term this most likely will make its way up to Monthly Resistance @ 9.6159
Short term- depending on the Sunday Gap I will be looking for a Buy Entry as low as possible before uptrend to Daily Resistance TP Goal @ .94835. Expecting a hard pull back before moving upwards to Monthly Resistance. This Should be a great Buy Trade . 250-300+Pips on the Daily Chart. I don't use Stop losses until in Profit so use risk Management .

5,000-6,000 pips of profit setting up here!EURNOK will do nothing for MONTHS and them WHAMMOOOO it goes crazy! Well this time crazy is awesome because it's helping confirm the big daily head and shoulders pattern we have.
We are looking for a 5000-6000 pip move here, large stops are required (above 9.50 right now) but much larger profits are expected. The break and retest will be good to help us get into this trade.
More details on this will unfold at ondemand.daytradersfx.com

EUR/NOK breaks major support 9.2570, good to go short on ralliesNorway's core inflation surged to record highs in July, dampening Norges Bank’s rate cut speculation.
The Krone has surged after inflation data release. EUR/NOK hit multi-week lows at 9.2094.
The pair has broken major trendline support at 9.2570 on the daily charts, we see scope for further downside.
50-DMA at 9.3507 is major resistance on the upside, while 9.1970 is next major support on the flipside.
Good to go short on rallies around 9.2500, SL: 9.3510, TP: 9.1970/ 9.1550/ 9.1375

EURNOK - possible long trade EURNOK has fallen to great support just above 9,20 area, including horizontal support and a long trendline since the bottom since april/may this year.
For now, we might have seen a whipsaw of possible longs, as the price was below trend support. If the price manage to go above the trend and close higher than current level, we might see a possible rebound.
Long trade setup:
Entry around 9,23-9,25. Stop if we close below 9,21 on a daily basis. target is set to 9,40.


Euro Nok der De Bullish ButterflyNok Nok, who's there? Bullish butterfly pattern.
Interesting harmonics coming up for EURNOK, ab=cd, bullish butterfly, with a .618 retrace from significant support to the top.
Rsi finding support. Butterfly's like to reverse quite quickly, but since they require large stops, it may be wise to wait until a reversal candle is shown.


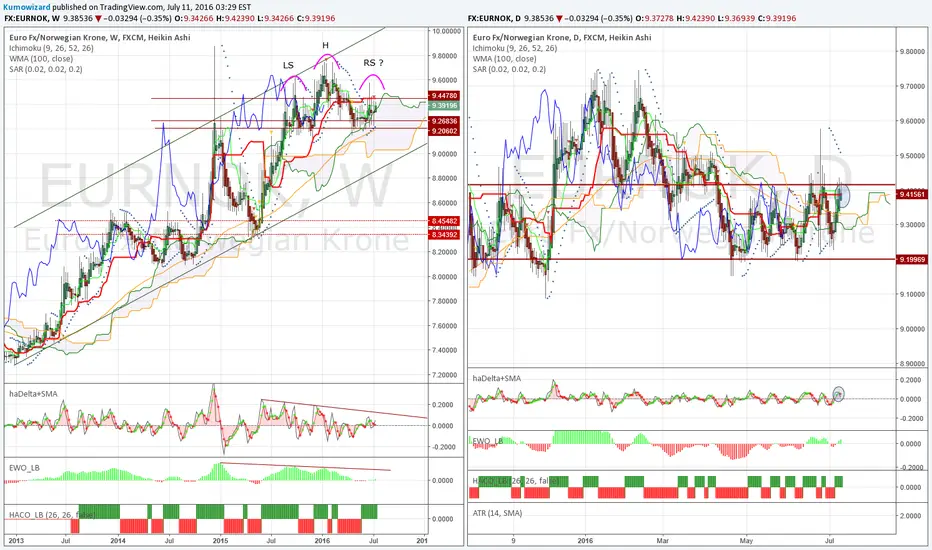
Bulls were blocked again at weekly KijunIt is very interesting, that despite massive fall (more than -25 %) in WTI and Brent Oil prices, somehow neither NOK, nor CAD react that much. What can be the reasons behind NOK relative strength compared to Oil price action? Well I have a few ideas, but for technical traders it should not matter. Only price action should matter. And EURNOK price action has been diverging.
Weekly:
- Ichimoku is still neutral, as price still holds within thick Kumo. What is very interesting, that despite price peaked above weekly Kijun Sen (26 weeks avg), Bulls were not strong enough to hold it above. We still have one more day until week end, but looks like recent candle close will be again below 9,45!
- Heikin-Ashi is used to filter price noise. But sometimes the noise is so laud, that goes through even the filter. Heikin-Ashi signals have been mixed for last 14 weeks. Sometimes it looks more bearish, then more bullish, but most often it reflects absolute indecision.
The last candle may become an inside cande, with a lower high. haDelta/SMA3 seems to turn down again.
- Let me get back to Ichimoku. There is one more important aspect there: Forward Senkou B, the orange line of the forward Kumo is up to 9,3680! This is the average price of the last 52 weeks! Meanwhile Senkou A (green) is very close to Senkou B -> thinner Kumo ahead would be easier to break.
This make 9,3650+ a very important key level! (soon you will see on daily too!)
- When price is below Kijun Sen but MACD crosses back above its signal line, also means indecision and range trading.
- EWO is slightly above zero, but no momentum gain.
- Real lower key level is 9,22
All in all it is a sleeping market, with still good chance to build a major Head and Shoulders top! H&S idea would be invalidated in case of a break and close above 9,55
Daily:
- It is a mess! Just because something is above or below the Kumo, doesn't mean firm bearish or bullish. Why? Because there is no trend without a substantial lower low or high! ANd this is exactly what has been reflected in the Ichimoku setup by absolutely flat longer term averages. Flat Kijun, llat Senkou A + flat Senkou B = thin and flat Kumo.
- Heikin-Ashi is in swing sell signal. It would be more bearish below 9,3675 again, but the real key level is still 9,20-9,22!
As you see the flat daily Kumo is in line with the weekly forward Senkou B. (Translation: 52 days average = 52 weeks average!).
- EWO shows only waves within a range, not much help.
- Also ATR shows extremely low volatility = typical sideaway mkt.
Below you can find my latest post on Oil. It is probably the most important factor for NOK. Besides this I have to mention, that NOK has been the worst perfoming G10 ccy in the last 3 years!!! And that has a consequence: higher, and continously increasing CPI in Norway! What if on top of this Oil once makes a reversal and start its target move to 60-65? Well, probably that would be a very good reason to sell massive amounts of EURNOK on the technical breakdown. But until further signals, just keep small short. Carry is slight positive.

EURNOK, 4H (Bearish Gartley Pattern).This trade should only be taken if we can limit our stops to lower level through a potential double top alongwith bearish RSI divergence. Look for retest o the previous structure at least.


Norway CPI beats estimations againPrice of Brent Oil is one thing. Inflation pick up caused by multi year ccy weakness is another thing. Today Norway's CPI numbers beatied all expectations on all front!
And finally, the price action of a ccy is the most important thing!
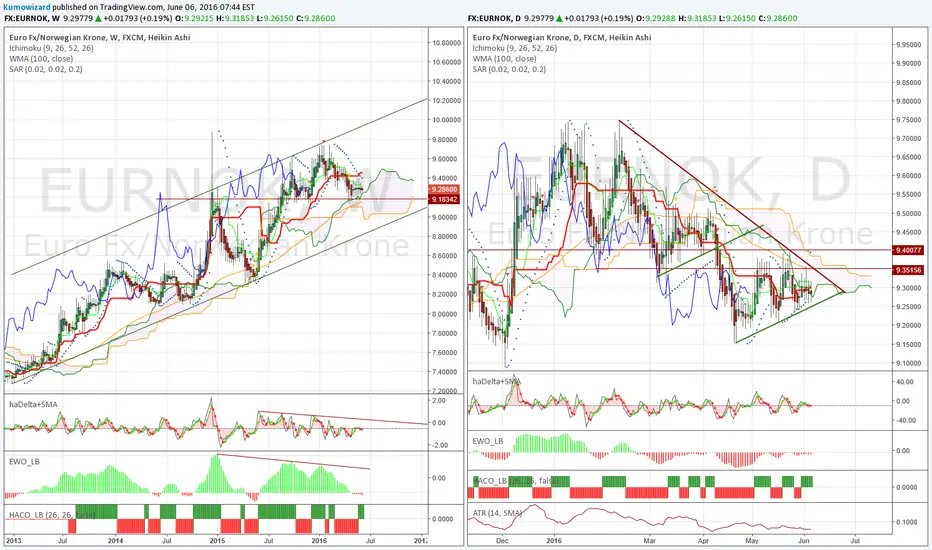
Weekly:
- Ichimoku neutral
- Possible long term Head and Shoulders is still in play, until Price holds below Kijun Sen (9,45)
- We have enterred the 12th week of sideaway consolidation. Sooner or later market will have t make a breakout from the 9,20 - 9,45 range
- EWO is close to zero
Earlier post on the link below.
Daily:
- Ichimoku is neutral, woth lot of mixed signals. Hard to follow Ichimoku alone, as the pair is clearly trading in a range.
- Heikin-Ashi candle and haDelta possibly signals a refusal of Kijun and range top again. As also ECB meeting is getting close, EURNOk can target 9,20+ again.
- EWO zig zag around zero.
I still like to keep 7-10 % of my overall portfolio in NOK. Yeah, I see the Oil is turning down again, but on the other hand there are a lot of positive arguments wh one should invest into the ccy of a real AAA rated, very innovative and liberal country, which has no debt at all! NOK has been a huge underperfomer in G10 for the last 3 years. Things tend to change at some point.

Negative divergences. If...then...- Ichimoku setup is neutral, until Price holds below 9,45 key level marked by Kijun Sen.
- Lower support/resistance zone is obvious, marked by 100wma and horizontal lines at 9,20-9,25
- Heikin-Ashi shows indecision, looking at haDelta I think price can not continue higher from here.
- haDelta and EWO shows a very long term negative divergence.
IF... THEN:
- If price can not close above Kijun, then it will dip into the Kumo cloud in coming weeks, probably testing 9,20+ again.
- If price once closes below 9,20 support, space will open to 8,95-9,00 first, the move would be quick.
- If price breaks 9,20, then a huge Head and Shoulders pattern gets validation. In that case any spike back to 9,20 from 8,95-9,00 will have to be used to sell.
I think EUR will remain under pressure in coming weeks. This can support short EURNOK positions.
The other important component is Brent Oil, which is consolidating now. If it can't turn bearish really, then EURNOK selling will be more agressive.
This trade idea is a long term play. Worth to follow!

EURNOK - Head & Shoulders (NOT THE SHAMPOO)I'm a big fan of price formations on larger time frames. The EURNOK is looking really nice for a 5,000-6,000 pip H&S. I continue to watch the price movements and will look to trade a re-test of the 9.5000-9.6000 right shoulder area (that's to test the waters and perhaps land a great entry). The real confirmation is price closing below 9.2000. You can see the symmetry and H&S projection areas. Let's get some pips. THIS TRADE AND OTHERS IS DISCUSSED AT DAYTRADERS FX and a video walkthrough can be found in the DAYTRADERS FX ON-DEMAND LIBRARY
Lovely pattern, expecting some solid profits.

EUR/NOK bears seem to be back in business after BrexitEUR/NOK bears seem to be back in business after banking on Brexit results, shooting star plummets prices, more bearish effects on cards:
After two days of crazily spiked bulls seems to have given up the momentum from the last couple of trading sessions.
On intraday charts, the pair has formed back to back shooting star and hanging man patterns at 9.4498 and 9.4458 levels respectively to evidence more bearish collapse in intraday trend.
Most notably, the current prices have again gone below DMAs
Shooting star occurred at peaks of rallies, (at 9.4443) (see monthly charts).
This bearish pattern with huge volumes which means weakness could be measured at this juncture.
While at the same juncture RSI touched overbought region and began converging to the price declines.
Stochastic has been indecisive at this stage but with slightly bearish favour.
Same is the case with MACD which is quite indecisive but shows a little weakness to prevail further.
Monthly prices are hanging 7EMA, any push below would take it to 9.15 levels for sure.

#EURNOK: Opportunity To Short!The pair was rangebound in a symmetrical triangle structure now it looks like the pair has broken out to downside so it is worth keeping an eye on this one for a trade set up
For more information in joining my professional signals group or professional online trading tuition, Message me directly on Trading view or email me with the email address on my Trading view profile page
Twitter: Tomkillick1
Email: T.killick182@gmail.com
Skype: Tom.killick182

For how long can NOK be this neutral?e room within the daily triangle is getting extremely tight. That means quite soon we'll see a breakout. Let's see the -bearish and bullish arguments.
Weekly:
- Ichimoku is neutral, with some bearish bias: a thick Kumo cloud shades price ahead. Price is below Kijun and Tenkan/Kijun has been weak bearish for a while.
- Heikin-Ashi is absolutely neutral: we had 5 doji weekly candles in a row. haDelta/SMA is stuck ard zero line.
- Lower key zone is 9,16-9,22 (horizontal line, 100WMA and Senkou B), upper key level is 9,40-9,42 (Kijun)
- EWO has seom bearish bias
- In case price can't break bck above 9,42, we may have a H&S like pattern development in progress. Obviously this idea
would be valid only with a brek below the potential neckline 9,15. Below that we still have 8,90-9,00 resistance the major trendline to fight with.
Daily:
- Ichimoku setup is neutral with bearish bias. We also have a medium strong bearish Tenkan/Kijun cross!
- Price is stuck in a triangle. The pattern is pretty much similar to the one we've seen in March-April.
First key is 9,25! If price breaks below the bullish trendline, we can have a leg down to 9,10-15
Upper key levels are: 9,35 / 9,40
- Heikin-Ashi is neutral
- EWO has bearish bias
I prefer to hold small short, with max stop at 9,42.
Eurnok Amazing Short BabyLooking good right now as breaking the lower Trend line of symetrical triangle
Reasons to short
Symetrical triangle breakout
About to reverse to downward trend
volume is on fire
Financial institutions are willing to sell
Similar Eur pairs are moving down and forming same sell patterns
1 By 4 Risk to Reward Ratio
Upper Trendline Rejection

#EURNOK: Potential Action Level Found, Shorts To Be Seen! #ForexTraders,
UPDATE: Seen some nice downside since I last posted (see related ideas)
Fantastic potential short here. We have an extremely strong resistance ceiling on price right where we are now, and am expecting a compelling upside move from here. Looks very, very compelling.
---Interested in joining my professional signals group, or receiving my professional online trading tuition? Message me here on Trading view or email me with the email address on my Trading view profile page---
Best regards,
Tom

#EURNOK: Potential Action Level Found, Shorts To Be Seen! #ForexTraders,
UPDATE: We are moving well after my previous idea on this pair (See related ideas) Seeing good downside now. Fantastic potential short here. We have an extremely strong resistance ceiling on price right where we are now, and am expecting a compelling upside move from here. Looks very, very compelling.
---Interested in joining my professional signals group, or receiving my professional online trading tuition? Message me here on Trading view or email me with the email address on my Trading view profile page---
Best regards,
Tom
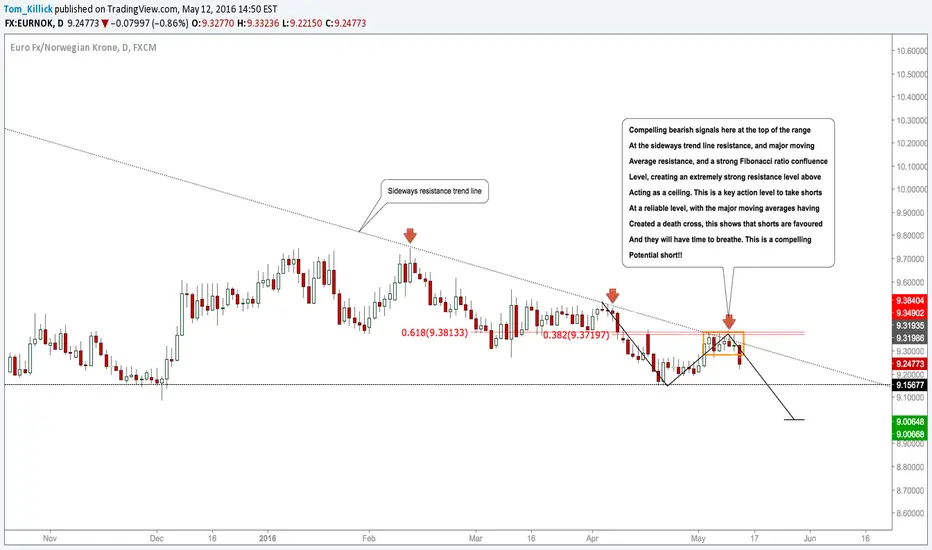
#EURNOK: Potential Action Level Found, Shorts To Be Seen! #ForexTraders,
Fantastic potential short here. We have an extremely strong resistance ceiling on price right where we are now, and am expecting a compelling upside move from here. Looks very, very compelling.
---Interested in joining my professional signals group, or receiving my professional online trading tuition? Message me here on Trading view or email me with the email address on my Trading view profile page---
Best regards,
Tom

