A better "Oil trade" than Oil itselfNorway depends a lot on Oil price and even more on the Oil industry! However it is still one of the real 'AAA' rated countries, with virtually no debt, and 0,75 % base rate. NOK has suffered a lot during last 2 years, being the worst performing G10 ccy. Weakness had its consequences: they have higher and increasing CPI, which makes Norges Bank less likely to cut rates further.
So if someone would like to bet on Oil mkt recovery, buying NOK (selling EURNOK or maybe USDNOK) can be a lot better choice than buying Oil futures contracts or Oil ETFs. Why? Simply because it EURNOK or USDNOK shorts you still have a minor POSITIVE carry if you hold, while rolling Oil longs can be very painful every month! Recent front end contract contango on Oil curve is ard 2 USD+ between every month, which is a massive negative carry risk.
Also you can be sure that Draghi will try to do "Whatever it takes", or at least communicate that way. Do you think the FED will not re-join this game? I think they will.
One can ask OK, but what happens if the otherwise really prudent and reliable Norgesbank alos joins ccy war? Well, never say never, any central banker can go crazy, but look at what has happened to Sweden? Riksbank cut to negative, doing QE and SEK is still performing quite well.
Efficiency of Central Bankers idiotism is reaching its absolute limits, you always have to look at things on relative value basis.
Weekly:
- Ichimoku is bullish, but price reached trend channel top few weeks ago.
- Heikin-Ashi is turning counter bearish. (candle, haDelta/SMA3, Oscillator). Below 9,42 it would break the wedge and Kijun Sen. Did it make a double top? If that gets confirmation Price tgt will be 9,10-9,15 area
- EWO negative divergence.
Daily:
- Ichimoku turned neutral: Price in Kumo cloud and below Kijun Sen. Watch if Senkou lines make a bearish cross 26 days ahead!
- Heikin-Ashi is bearish. haDelta/SMA3 cross down below zero.
- EWO is down to zero -> watch if turns bearish.
KEY LEVEL 9,40+!
p.s.: I hold decent short position.
EURNOK trade ideas


EURNOK 15m 1month bottom of range bouncing supportBuying on the bottom of the range near a support area, betting on the price bouncing back to the reversal zone

EURNOK - 2H - SharkFirst potential setup for the week ahead. I think its likly that will come up further. The real question is whether or not we will make it all the way up. Sometimes sharks still tend to reverse at the 786 cypher reversal zone - but the risk reward wouldnt be that great if youd enter at the 786 straight away with all that upside reversal potential a shark has.
but ofc i will watch for doubletops on lower timeframes even in the 78.6 area as well as the 88.6 area to maybe catch the reversal if its happing before my prevered PRZ-zone

Bullish picture, but limited upside from here.First of all I marked this post as "SHORT", but I don't mean this market is strategic bearish. I'd rather like to point to a possible top and a pull back.
Weekly:
- Bullish Ichimoku, but price far above equilibrium (Kijun and Senkou B lines), and also reached possible channel top
- Heikin-Ashi is bullish, need to check candle body size at the end of the week.
- EWO bullish, but probably building some negative divergence --> in case it won't make a higher print from here.
Daily:
- Bullish Ichimoku with Price far above Kijun Sen. Kijun started to catch up. Supports are at 9,60 / 9,47 / 9,40.
- Heikin-Ashi may signal momentum loss today --> watch haDelta/SMA3 which already signals some weakness compared to price.
- Price trades within two possible bearish wedges. The shorter one has become very tight. The longer "wedge" lines converge very slowly, with a possible resistance ard 9,80, which means unless Oil immediately collapses to 20 USD, Bulls have very limited upside here in EURNOK longs. Especially that NOK has been the worst performer G10 for the last 1,5-2 years.
Should we see some rebound in Oil, risk correction in general, and as technical condition Price break below 9,60, then EURNOK has chance to show correction down to 9,40-9,47 area.

EURNOK shorting off highs and possible H&S 15min 2wkPossible head and shoulders forming but also a topping pattern of lower highs and doji candles.

Sell at range top.Weekly:
- Trend and Ichimoku setup is still bullish
- Heiki-Ashi (candle and haDelta) shows slowdown in bullish momentum.
- Possible bearish divergence in EWO
Daily:
- Ichimoku setup is bullish biased, but should be considered as neutral until Price doesn't make a clear higher high or lower low around the Kumo. Therefor I think this pair is and stuck and will likely stay in 9,15-9,60 wider range.
- Heikin Ashi shows consolidation at range top, a pull back is possible. haDelta has serious negative divergence, crosses down but stuck around zero line. Oscillator is bearish.
- I still think we'll see a retracement to 9,35 equilibrium, especially if Oil recovers a bit more.

EURNOK short off 7th tested top 15m 2wkwe are seeing a topping pattern that continues to get tested. Best way to play it is to bet on past patterns repeating itself until the inevitable breakout.


Brent, CPI, Norges, 9,60 refused -> GOTO 9,35- Brent Oil is still under heavy selling pressure. This and previous general Euro buying caused a sharp spike from 9,20 to 9,60 in EURNOK.
- However NOK Bears could not push the price above 9,58-9,60 key resistance since 8/Dec. Seven failed attempts.
- Norwegian CPI last week was higher than expected despite falling oil prices.
- Market believed in a Norges Bank rate cut with 50-50 chance, but Norges kept its benchmar on hold at 0,75 %. For me it was not surprising at all, given the fact ECB was less dovish and the above mentioned CPI number.
Tech:
- Ichimoku bullish biased, but bullish Kumo breakout missed textbook confirmation, as price did not make a higher high above 9,60 prev resistance.
- The pair faced heavy selling after Norges decision today. Price is down -1,4 % as bulls unwinding positions. Price reaching Tenkan Sen. We had 5 candles showing undecision and choppy trading in a wide range of 9,43-9,59. Today Heikin-Ashi candle has huge upper and lower wicks again, but this time a red body! haDelta/SMA3 however may dip below zero line. -> Turning bearish!
- Pull back on its way, with possible initial tgt to 9,30-9,35.
If you want to enter swing short, do not rush, as this G10 pair has been trading like a wild EM cross! Try to catch spikes to 9,48-9,52.


#EURNOK Bearish Kumo breakout confirmed by Chikou SpanBearish momentum may accelerate finally. Of course a lot depends on OPEC meeting. Obviously a cut in Oil production would cause spike in Brent price and would make NOK even more attractive.
Daily update:
- Price below Kumo Tenkan and Kijun (bearish)
- Tenkan/Kijun is strong bearsih
- Chikou Span bearish cross below past Kumo -> validation of bearish Kumo breakout
- Heikin Ashi is bearish, haDelta/SMA3 cross down below zero line
- EWO is bearish
Targets (in line with weekly supp/resistance levels): 9,00 or 8,80
Strategy: Hold shorts.

More bearish confirmation. Sell more!We have more bearish confirmation signals today:
- Bearish weekly Heikin Ashi signal. Possible tgts are 9,00 / 8,80
- Bearish daily Ichimoku setup with confirmation of bearish Kumo breakout
- Bearish daily Heikin Ashi setup
- Bearish EWO wave starts in line with Ichimoku setup.
Sell more, and hold shorts! It really has room to catch up (down :-) ) to other EUR crosses.
Stop reversal only above 9,35, trail stop with Kijun Sen + buffer.


Trigger fingerThe Big Lagging Ccy in G10 may finally catch up strength against EUR! ... I hope... as I've called it 3 times already recently :-)
Instead of weekly where we still see bullish consolidation, I put on the
Monthly:
- Clear pull back signal is setting up in Heikin Ashi candles: 2 inside body candles with lower highs, and the second one is close to a doji.
- EWO also reached an extreme high, while candle peaks are lower.
-Longer term Ichimoku supp/res is ard 8,90 (monthly Kijun Sen)
Daily:
- we have seen volatile zig-zag within/around Kumo, but price could not break and stay above Kijun Sen since October!
- Heikin Ashi turns bearish again, Price attempts a bearish Kumo breakout, trendbreak and also break of horizontal key support. If it stays below 9,22-9,25, selling can quickly accelerate down to 9,00
- EWO is at zero: no trend wave
Again, it looks like a sell, but this ccy is really a tricky one. As one of my friends always say: "I hate NOK, because it trades like EM, just without any positive carry!" ...Of course he still trades it sometimes :-)

Norges on hold. Get ready to enter shortsNOK has been lagging too much. While all majors got stronger against EUR since Drgahi's last action, NOK rather got stuck. This ccy has been the weakest among G10 for the last 1,5 years.
Norges Bank left key rate unchanged at 0,75 % today. Some bulls who believed in surprise cut, and dovish statement had started to unwind their longs already, but key reversal area is still a bit lower.
Weekly:
- Ichimoku bullish, trend bullish. - as goes the Oil. However Price has been below Tenkan Sen (9 weeks avg) for last 4 weeks.
- Heikin Ashi: some early warning in haDelta + candle has a lower high.
- Lower key levels are: 9,20 / 9,00 / 8,80+
Daily:
- Ichimoku is neutal. Price has failed to break back above Kumo and Kijun sen 5 times!
- Bullish trendline is close to be tested ard 9,26. Kumo bottom at same level
- Key area is clearly 9,20-26 on the daily too. A break below this could accelerate selling.
- Heikin Ashi shows serious undecision: doji like candles in a row: Buls always try to push it higher then they fail. Today candle has very long wicks, with candle body mid at equilibrum of 9,35. haDelta has a bearish warning!
I sold some small after Norges decision this morning. Bigger size I would do only below 9,26 as we still need more confirmation signals!

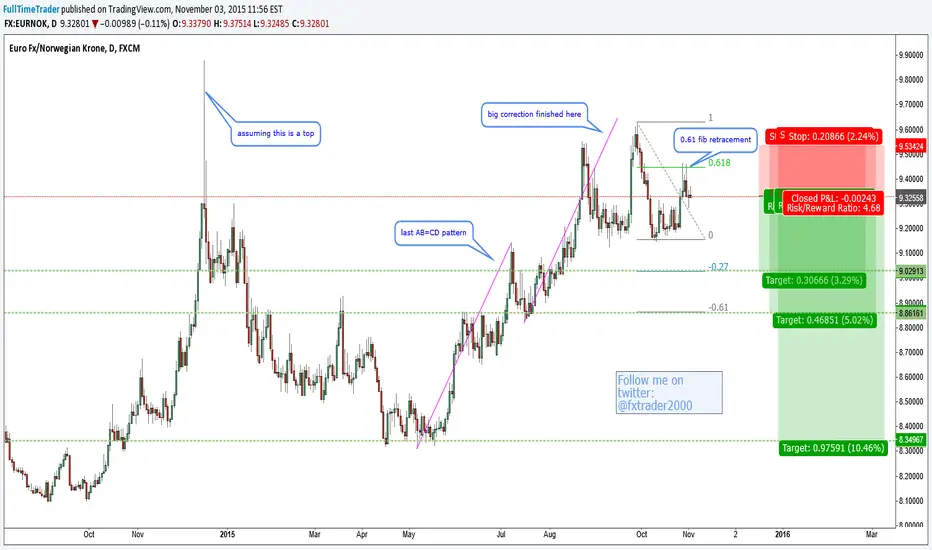
EURNOK-expecting a decline after a 0.61 pullbackMy last attemp to short this pair failed. I still think a big decline should follow on this pair. I want to trade this pair long-term.
We can see a big correction (AB=CD pattern) finished before. After that a possible zigzgag is forming, first leg followed by a 0.61 fib pullback.
Fundamentals also support this bias: more EUR weakness expected due to possible extended QE. NOK economy is based mainly on oil exports and my bias is that oil should start a rally soon.
Regards.
*****************DISCLAMER********************************************************************
Always do your own analysis before opening a trade.
Any respectful and constructive ideas are welcome (agree or disagree).
Follow me on Twitter for updates: @fxtrader2000
EURNOK: Detecting Possible Trend Change Using The Obvious #ForexTraders
Looks like it's ready to be shorted. Im not bearish until er see lower trading Monday, but Im sure we will see that happen.
Tom

EURNOK-could continue a long term declineJust like the EURCAD and EURAUD, i think this pair reached a top and a log term decline is starting.
More than that, this pair is extremely overbought, we can see it on monthly chart.
The EURCAD and EURAUD are already gone. We can still trade this pair using this setup.
Right now price is consolidating forming a nice inverted pennant/flag. My prefered scenario is that price will break to the downside and will reach the projected pennant target. Just in case a place another two targets following my money management system.
A conservative entry would be to place sell stop orders below the level shown on chart. This depends on each trader, i prefer to enter now to have a better R/R ratio.
Best regards.
*****************DISCLAMER********************************************************************
Always do your own analysis before opening a trade.
Any respectful and constructive ideas are welcome (agree or disagree).
Follow me on Twitter for updates: @fxtrader2000

Nice correction, maybe reversal later, but watch out haDelta!Weekly:
- Ichimoku setup is still bullish with lower support around 9,00 and 8,80.
- Heikin Ashi shows a correction has started this week. This correction may extend to 9,00 +/- area in coming weeks
Daily:
- Looks like a trend break. Also looks like a possible bearish reversal is taking place and firming BUT...
- ... but Ichimoku setup is still just neutral, with Price in the Kumo. Even if Price makes an initial attempt to break lower, that will be likely followed by a spike back to Kumo. Or the other case is that the momentum starts to slow down a bit here ard 9,10-9,20 area, we see a pull back up to 9,30-9,40 supp/res, then on next try it breaks below 9,15 and tgts 9,00.
- Watch out for smoothed haDelta! It has made an extreme low., and it has a negative divergence compared to price. This strong bearish momentum is not sustainable short term. Maybe reduce, hedge some of your counter shorts, or sell short dated (2 weeks) covered puts @ 9,00 or 9,05 strike to pick up some extra premium.
I think most likely we will see some consolidation here ard 100 day WMA and Kumo. ether it happens with a dip and spike back, or with a correction up and a break down later is a question, but maybe second scenario has higher probability gvn haDelta location. Anyway, I'd keep some shorts, or would sell on spikes still.
So my bias is still counter bearish, but there are some signals to be careful here with the momentum.

Norges Bank loves the ccy war! I like counter short.Well, the last central bank who I thought would not lose its mind seems to join global idiotism, thinking that through FX channel their problems will be solved or at least would soften!
Hey helloooo Gentlemen! Your ccy has been the weakest among G10 for abt 1,5 years now! Did this relative weakness solve any part of your problem? Nope. So why do they think more FX weakness would help their economy???
The reason why Norway is "sufferring" a bit of backdrop is the structure of their real economy. They have two kind of products: Salmon (maybe less important) and Brent Oil.... so basically they can weaken their ccy to anywhere, if no one will buy Oil and other machinery products used in oil industry (by oil producers, distributors, etc.), there will be no GDP growth, no inflation, etc.
So the thing is, they should do intervention in Oil market rather than in FX :-)
Anyway... I got stopped out of my EURNOK shorts on the day of rate decision, but somehow I still like Norway. After all it is still AAA rated with no Debt (at least QE can't be an option there later), and they still have their savings in their national oil fund.
Technicals
Daily:
- Bullish trend resumed with heavy buying after rate cut. Ichimoku setup is bullish. Supports are 9,30 and 9,15.
- Heikin Ashi picture is still bullish, but after haDelta has just printed an extreme high (and started to pull back lower since then -> momentum slows a bit), a consolidation or correction should soon happen.
4H:
- Bullish Ichimoku setup, but Price got too quickly too far above its short term equilibrium, and it is currently still too far above Kijun Sen!!! Kijun and Kumo should attract price back.
- Heikin Ashi candles are still green, but watch out for the massive negative divergence in haDelta! Smoothed haDelta is already back to zero, while price has not yet pulled back even a little bit!
- I think if we see a reversal candle and Price dips below Tenkan Sen, we can see a quick correction down to 9,45 +/-. SAR already hit: bulls should start to reduce / exit longs.
I like to have some counter short again.

Is the bullish trend close to end?Weekly:
- BullishIchimoku setup, but Price got far above the 9,00 equilibrium level, should retest Kumo
- Lower supports are: 9,15 (Tenkan Sen), 9,00 (Kumo and Kijun Sen), 8,60-8,70 area as strongest trend support
- Heikin Ashi candle this week seems ti print an inside body and no higher high. haDelta crosses below SMA3.Bullish momentum slowed as Price could not close above 9,40-9,50 resistance area for second week.
Daily:
- Ichimoku setup is bullish, but as 5th Elliot wave might have been completed, so we have to watch 9,20 closely! We have Kjiun Sen and trend support there. If those break now, or later in A-B-C wave, that will be a beginning of a bearish move.
- Heikin Ashi signal is bearish. Please note that haDelta/SMA3 failed to move back above zero line, they made a bearish cross below. This suggests more possible bearish bias ahead.
- It still may be just a Kijun Sen retest, and Price can go up again, but it will be very important to see if it makes a higher high from here or not.
I slowly started to increase my strategic NOK exposure again. No rush, don't chase, play it slowly according to your system reuirements (entry signal, stop, position size)
You can also check historical charts for GBPNOK and NOKSEK. Really interesting, and makes me question if NOK really has to be this "cheap" compared to all other G10?

Potential Continuation of Long Term UptrendPotential continuation of long term uptrend following bounce off ascending channel support strengthened by 2009 and Jul-2015 resistances. Uptrend confirmed by bullish price and 50 MA both above bullish 200 MA. Potential trade following break of Jan-2015 resistance beyond circa 9.3000 up to target of 2009 resistance circa 9.7200. Potential 4.5% gains at a 1:2 risk to reward ratio.
