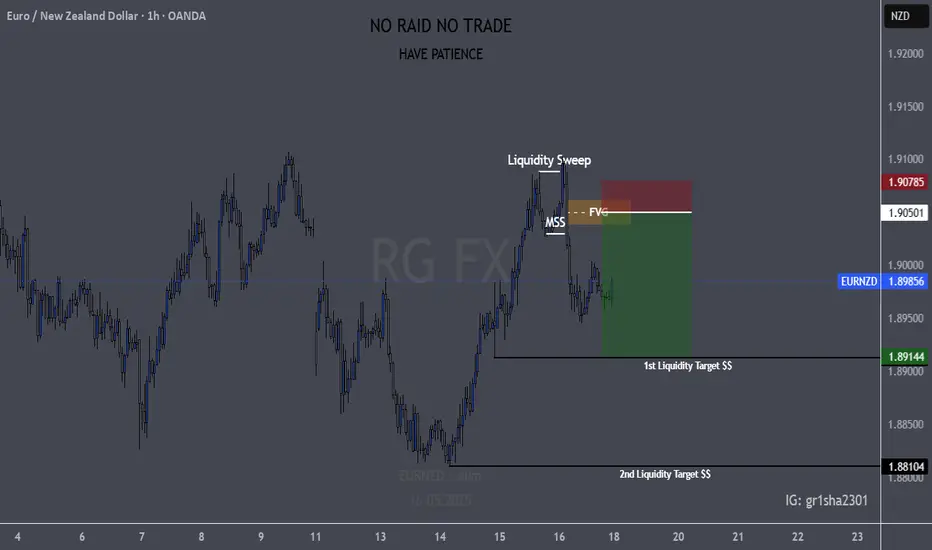
EURNZD 1hr Potential Sell setupWe have a 1hr liquidity sweep with MSS, which has created FVG for our entry. Both TP targets are the main liquidity levels marked. We'll just have to wait and see if the trade will trigger and if it plays out.
EURNZD trade ideas
EURNZD Analysis: Bounce & BreakoutHello traders!
EURNZD is in a 1h range and is offering two trading scenarios.
The first scenario suggests the pair may react bearishly from the resistance zone, setting up a bounce opportunity that could drive price lower toward the 1.90000 area.
The second scenario anticipates a breakout above the resistance zone, followed by a retest, which could present a strong opportunity for continuation toward the 1.92000 area.
Discretionary Trading: Where Experience Becomes the Edge
Discretionary trading is all about making decisions based on what you see, what you feel, and what you've learned through experience. Unlike systematic strategies that rely on fixed rules or algorithms, discretionary traders use their judgment to read the market in real time. It's a skill that can't be rushed, because it's built on screen time, pattern recognition, and the ability to stay calm under pressure.
There's no shortcut here. You need to see enough market conditions, wins, and losses to build that intuition—the kind that tells you when to pull the trigger or sit on your hands. Charts might look the same, but context changes everything, and that's something only experience can teach you.
At the end of the day, discretionary trading is an art, refined over time, sharpened through mistakes, and driven by instinct. It's not for everyone, but for those who've put in the work, it can be a powerful way to trade.

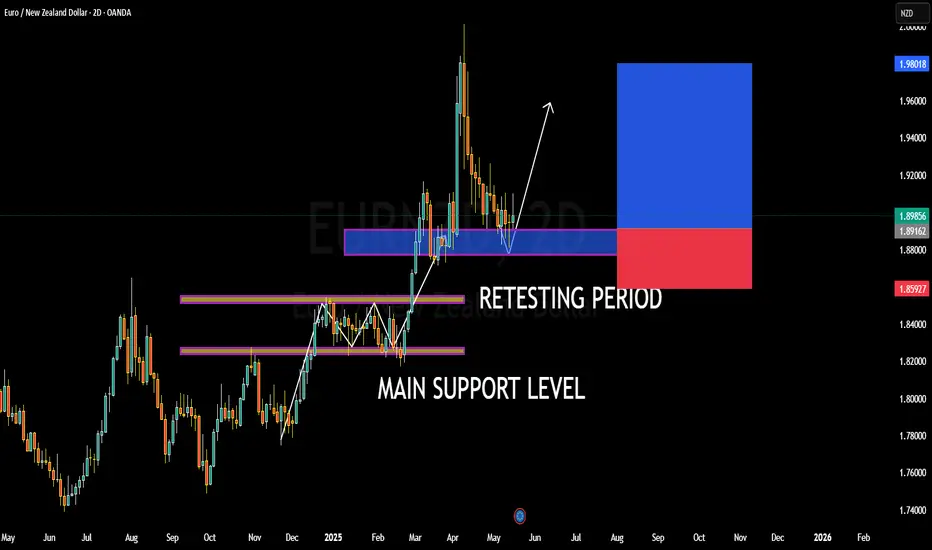
EURNZD BULLISH OR BEARISH DETAILED ANALYSISEURNZD is currently trading around the 1.89 zone after successfully completing a retest of its prior breakout area. This level aligns perfectly with a key historical demand zone, where previous resistance has now flipped into strong support. The market structure remains bullish, and the recent higher-low formation combined with increased volume suggests the pair is gearing up for its next impulsive move to the upside. The price has respected the support zone with precision, signaling institutional interest and a favorable risk-to-reward ratio for long positions.
From a fundamental perspective, the euro remains relatively supported against the New Zealand dollar due to diverging monetary policy expectations. The European Central Bank is maintaining a cautious but slightly hawkish tone amid sticky core inflation, while the Reserve Bank of New Zealand is under pressure to ease policy later this year due to softening economic indicators, including a slowdown in GDP growth and weaker labor market conditions. These macro drivers favor a bullish bias on EURNZD as capital flow leans toward safer, yield-protected assets in the eurozone.
Technically, this setup has clean market geometry. The pair has broken through a multi-month consolidation structure and is now retesting the breakout with confluence from the main support zone at 1.88–1.89. With momentum building and volume increasing on the bounce, the setup is valid for a continuation toward the 1.99 level, especially if the pair reclaims the minor resistance at 1.9050. Breakout traders and position holders should monitor this area closely for confirmation.
Overall, this is a textbook bullish continuation play. The market has absorbed sell pressure at a critical level, and the successful retest confirms the strength of the new support base. With both technical structure and macro fundamentals aligned, this setup offers high potential for trend continuation, and I'm anticipating a strong move toward 1.99 in the coming weeks.
EURNZD What Next? BUY!
My dear followers,
This is my opinion on the EURNZD next move:
The asset is approaching an important pivot point 1.8840
Bias - Bullish
Technical Indicators: Supper Trend generates a clear long signal while Pivot Point HL is currently determining the overall Bullish trend of the market.
Goal - 1.8961
About Used Indicators:
For more efficient signals, super-trend is used in combination with other indicators like Pivot Points.
Disclosure: I am part of Trade Nation's Influencer program and receive a monthly fee for using their TradingView charts in my analysis.
———————————
WISH YOU ALL LUCK

Eurnzd I posted this eurnzd and we hit the first tp then the second hit sl be4 getting to de tp 1 but am expecting price to go back to the entry then we can have another entry to the upside

EUR/NZD is Showing Strong Bullish MomentumEUR/NZD is showing strong bullish momentum: The pair has been moving upwards since reaching the support level at 1.8807, and the bulls have been in control since then.
We expect the first target at 1.9130 to be reached soon.
If the price breaks above this level with strong momentum, the next target is 1.9245.
Overall, buyers seem to be driving the market.

EURNZD – 1H Bullish Divergence - Bullish SetupEURNZD – 1H Bullish Divergence | Reversal Setup Brewing 🔄📈
Hey traders 👋
We’re spotting a clean bullish divergence on EURNZD’s 1H timeframe — and it’s developing right at a potential turning point. If you're hunting for a sharp intraday reversal, this setup deserves your attention.
🔍 Technical Breakdown
Price action: Making lower lows
Momentum indicators (RSI / MACD): Printing higher lows
That’s your bullish divergence, loud and clear — signaling that although price is falling, the momentum behind the drop is fading fast.
This kind of divergence often appears before a sharp bounce or a trend shift — especially on the 1H.
⚡ Confluence (What Makes This Setup Stronger)
Divergence forming at a local support zone
Multiple rejections at the low – showing buyer interest
Price slowing down — candles getting tighter = potential squeeze before expansion
🎯 Trade Plan
Aggressive Entry: Off the divergence low, using candle confirmation
Conservative Entry: Wait for a break of minor structure high or trendline
Stop Loss: Below the swing low
Targets: Prior resistance zones or fib retracement levels (38.2% / 61.8%)
This is not about guessing direction — it’s about reading the shift in momentum before price reacts.
📌 EURNZD Bullish Divergence on 1H – Is the Trend About to Turn?
What’s your entry game here — early off the divergence or waiting for a clean breakout?
#EURNZD #ForexTrading #BullishDivergence #PriceAction #TechnicalSetup #1HChart #ReversalPlay #SmartMoney #MomentumShift #FXIdeas

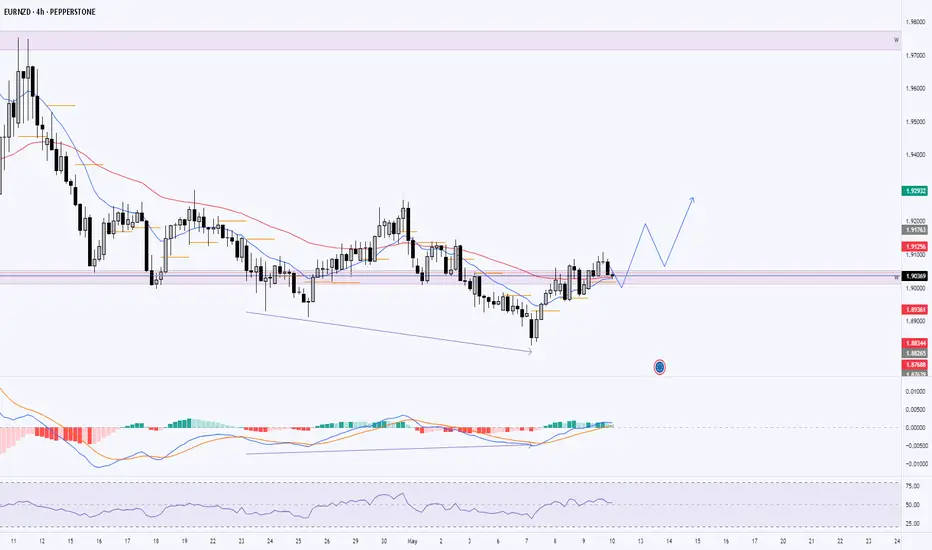
Today's analysis is full of scribbles...Well, we've got a clean setup with a range box, indicating a weakening bearish trend. There's an Elliott correction that seems to have completed and now the overall bullish trend is likely to resume.
We're seeing a strong uptrend on the weekly timeframe. The bullish BOS (Break of Structure) has been touched several times and looks exhausted now.
We've got a key Fibonacci level, which is the most important area right now. There are multiple order blocks around as well.
In short, I gave you a simple breakdown — go ahead, analyze it yourself and look for entries.
Wishing you all success and green trades!

EUR/NZD SENDS CLEAR BEARISH SIGNALS|SHORT
Hello, Friends!
EUR/NZD pair is trading in a local downtrend which know by looking at the previous 1W candle which is red. On the 5H timeframe the pair is going up. The pair is overbought because the price is close to the upper band of the BB indicator. So we are looking to sell the pair with the upper BB line acting as resistance. The next target is 1.891 area.
Disclosure: I am part of Trade Nation's Influencer program and receive a monthly fee for using their TradingView charts in my analysis.
✅LIKE AND COMMENT MY IDEAS✅

BULLISH BIASWe are in a bullish trend as price created a BOS that pushed the market to reach resistance zone before pullish back to establish a new bearish BOS.
Price pulled back lower to then sweep lower liquidity, touching support before swinging up currently.
Target 91288 as 1st take profit.

eurnzd analysis elliot. Don't forget about stop-loss.
Write in the comments all your questions and instruments analysis of which you want to see.
Friends, push the like button, write a comment, and share with your mates - that would be the best THANK YOU.
P.S. I personally will open entry if the price will show it according to my strategy.
Always make your analysis before a trade

EUR-NZD Support Ahead! Buy!
Hello,Traders!
EUR-NZD keeps falling
But the pair will soon
Retest a horizontal support
Level of 1.8732 so after
The pair makes the retest
We will be expecting a
Local bullish rebound
Buy!
Comment and subscribe to help us grow!
Check out other forecasts below too!
Disclosure: I am part of Trade Nation's Influencer program and receive a monthly fee for using their TradingView charts in my analysis.

EUR/NZD Forex Heist: Thief Trading Style Strikes! Greetings, Profit Hunters & Market Raiders! 🤑💰✈️
Prepare to plunder the EUR/NZD Forex Market with our slick Thief Trading Style, fusing razor-sharp technicals with savvy fundamental insights! 📊🔥 Our mission? Dive in for a bearish score, targeting the high-risk Green MA Zone where oversold conditions, consolidation, or a bullish reversal could trap the unwary. Let’s grab the loot and slip away like pros! 🏆💸
📈 The Forex Heist Blueprint
Entry Point 🚪:
🏴☠️ Bearish Strike: The vault’s open—pounce on the bearish move at any price! For precision, place Sell Limit Orders at the nearest 15M/30M swing high/low for pullback entries.
Tip: Set a chart alert to snag the perfect entry! 🔔
Stop Loss (SL) 🛑:
Place your Thief SL at the nearest 5H swing high (1.91000) for swing trades.
Adjust SL based on your risk, lot size, and number of orders. This is your escape hatch—use it wisely! ⚠️
Take Profit (TP) 🎯:
Aim for 1.85000 or exit early for safety if the Green MA Zone shows reversal signs.
Escape Plan: Watch for bullish strength or consolidation to avoid getting caught! 🚨
📡 Why EUR/NZD?
The EUR/NZD market is in a bearish trend 🐻, fueled by:
Fundamentals: Eurozone economic struggles vs. NZD resilience.
Macroeconomics: Weak Eurozone data contrasts with NZ’s export strength.
COT Data: Speculative bets lean bearish on EUR.
Intermarket: NZD gains from commodity correlations; EUR lags on energy costs.
Quantitative: Technicals (RSI, MA crossovers) signal bearish momentum.
🧠 Sentiment Outlook
Retail Traders:
🟢 Bullish: 38% 😊 (Eyeing EUR rebound on oversold signals)
🔴 Bearish: 50% 😟 (NZD strength and Eurozone woes dominate)
⚪ Neutral: 12% 🤔
Institutional Traders:
🟢 Bullish: 25% 💼 (Hedging for EUR recovery)
🔴 Bearish: 65% ⚠️ (NZD favored on trade and yield flows)
⚪ Neutral: 10% 🧐
⚠️ Trading Alert: News & Risk Management 📰
News can flip the market like a switch! Protect your haul:
Avoid new trades during high-impact news releases.
Use trailing stop-loss to secure profits and limit losses.
Stay alert—volatility is our ally, but only with a plan!
💪 Join the Thief Trading Squad!
Tap the Boost Button to supercharge our Thief Trading Style and make this heist legendary! 🚀 Every boost strengthens our crew, letting us raid profits daily with ease. Let’s dominate the EUR/NZD market together! 🤝
Stay locked in for the next heist! 🐱👤 Keep your charts primed, alerts set, and trading spirit wild. See you in the profits, raiders! 🤑🎉
#ThiefTrading #EURNZD #ForexHeist #TradingView #GrabThePips

EURNZD Short Term Buy Trade Update!!!Hi Traders, on May 8th I shared this idea "EURNZD - Expecting Bullish Continuation In The Short Term"
I expected retraces and bullish continuation higher from the marked Fibonacci support zones. You can read the full post using the link above.
Price reached the first Fibonacci support zone, respected it and bounced higher as expected!!!
If you enjoy this idea, don’t forget to LIKE 👍, FOLLOW ✅, SHARE 🙌, and COMMENT ✍! Drop your thoughts and charts below to keep the discussion going. Your support helps keep this content free and reach more people! 🚀
-------------------------------------------------------------------------------------------------------------------
Disclosure: I am part of Trade Nation's Influencer program and receive a monthly fee for using their TradingView charts in my analysis.

EURNZD 12/05/2025Weekly:
-Weekly low could be rejected again.
-Bullish M pattern.
Daily:
-Bullish M pattern.
-OB.
-M formation.
-Daily lows.
4H:
-Inverse H&S pattern.

EURNZD Bearish Reversal Confirmed: Break and Retest Below Key Su🧠 Market Context & Structure:
Trend Analysis: The pair is currently in a bearish structure. This is evident from lower highs and lower lows forming after a failed bullish breakout attempt.
Key Zone: A supply zone (highlighted in red) around 1.90198 – 1.90750 has acted as a strong resistance. Price was rejected here after retesting.
Break of Structure (BoS): A clear bearish breakout below the ascending trendline and the horizontal support confirms a shift in sentiment.
📉 Indicators & Confluences:
EMA Analysis:
EMA 50 (red): 1.90757
EMA 200 (blue): 1.90728
Price is trading below both EMAs, which confirms bearish momentum. Also, a bearish EMA crossover (50 crossing below 200) may be forming or has just occurred — a death cross, which further supports downside bias.
🎯 Trade Setup Breakdown (Bearish Bias):
Entry: Around 1.89760 (current price)
Stop Loss: Above the supply zone (~1.9020 - 1.9070)
Take Profit Target: Around 1.86035 (highlighted in green), aligning with previous demand zone or measured move.
Risk-to-Reward Ratio (RRR): Estimated at ~3:1, making this a favorable setup.
🔽 Technical Patterns:
Bear Flag / Rising Wedge: The broken ascending pattern suggests a bearish continuation.
Retest Confirmation: Price retested the broken structure before continuing down — classic bearish retest behavior.
✅ Conclusion:
This is a textbook bearish setup supported by:
A failed breakout and structure shift
Resistance at a key supply zone
Break and retest of support
Price under both EMAs (bearish confirmation)
📌 Bias: Bearish
📌 Invalidation Level: Close above 1.9075
📌 Next Support Zone: 1.8600–1.8550 range

eurnzd buy signal. Don't forget about stop-loss.
Write in the comments all your questions and instruments analysis of which you want to see.
Friends, push the like button, write a comment, and share with your mates - that would be the best THANK YOU.
P.S. I personally will open entry if the price will show it according to my strategy.
Always make your analysis before a trade

EURNZD Under Pressure! SELL!
My dear subscribers,
EURNZD looks like it will make a good move, and here are the details:
The market is trading on 1.9051 pivot level.
Bias - Bearish
Technical Indicators: Both Super Trend & Pivot HL indicate a highly probable Bearish continuation.
Target - 1.8984
About Used Indicators:
The average true range (ATR) plays an important role in 'Supertrend' as the indicator uses ATR to calculate its value. The ATR indicator signals the degree of price volatility.
Disclosure: I am part of Trade Nation's Influencer program and receive a monthly fee for using their TradingView charts in my analysis.
———————————
WISH YOU ALL LUCK

EURNZD I Technical Analysis & Forecast Welcome back! Let me know your thoughts in the comments!
** EURNZD Analysis - Listen to video!
We recommend that you keep this pair on your watchlist and enter when the entry criteria of your strategy is met.
Please support this idea with a LIKE and COMMENT if you find it useful and Click "Follow" on our profile if you'd like these trade ideas delivered straight to your email in the future.
Thanks for your continued support!Welcome back! Let me know your thoughts in the comments!

EURNZD: Bullish Continuation is Highly Probable! Here is Why:
It is essential that we apply multitimeframe technical analysis and there is no better example of why that is the case than the current EURNZD chart which, if analyzed properly, clearly points in the upward direction.
Disclosure: I am part of Trade Nation's Influencer program and receive a monthly fee for using their TradingView charts in my analysis.
❤️ Please, support our work with like & comment! ❤️

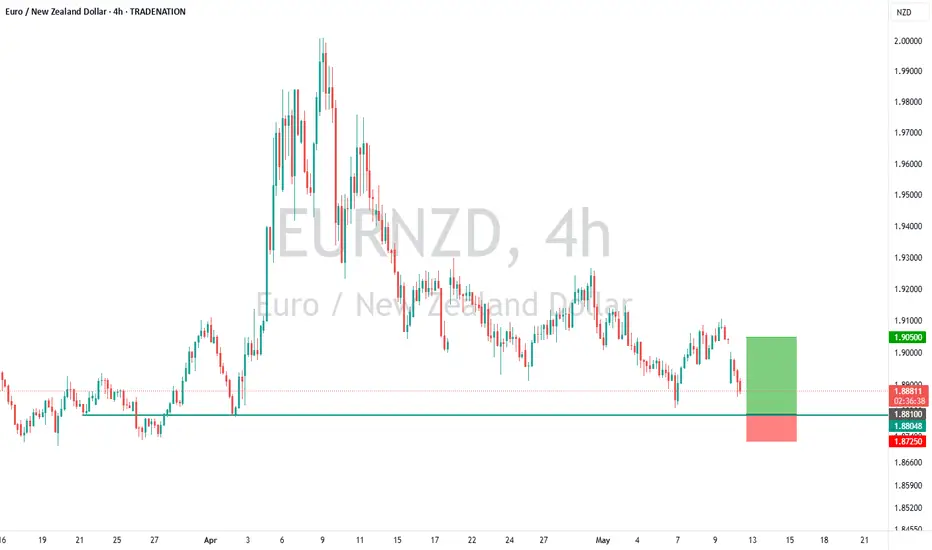
Trade Idea: EURNZD – Buy on Dip Toward Trend Line SupportExpires: 13/05/2025 06:00
Trade Idea
Type: Buy Limit
Entry: 1.8810
Stop Loss: 1.8725
Target: 1.9050
Duration: Intraday
Technical Overview
The primary trend for EURNZD remains bullish, with recent price action showing a controlled pullback.
Price is approaching a well-defined ascending trendline, offering strong support near 1.8800.
Buying on dips into this zone offers a favorable risk/reward opportunity.
Disclosure: I am part of Trade Nation's Influencer program and receive a monthly fee for using their TradingView charts in my analysis.
EURNZD..LONGOANDA:EURNZD
Analysis complete — scenarios outlined. The zone could be a decision point for . Price reaction here may define the next move.
If price breaks and pulls back to retest, a reversal setup might emerge.

EURNZD Buy – Retest at Weekly Breakout Zone📅 Date: 11/05/2025🕒 Timeframe: 4H / 1H
🔍 Market Bias:
Trend direction: Uptrend
Key structure: Higher highs and higher lows in 4h.
Fundamental/Bias if any: No major news scheduled; technical setup driven
📊 Technical Analysis:
Key Support/Resistance zones:
1.90116 - 1.90515 – Weekly Resistance turned Support
1.90265 – Minor 4h Resistance
Indicators used:
EMA50: Price is holding above both on Daily and 4H, indicating bullish momentum
MACD: Showing early signs of bullish divergence on Daily timeframe
Chart patterns / Price Action:
Retest of broken weekly resistance with rejection wick
4H market structure shift + price breaking above EMA50 – early sign of trend continuation
🟢 Entry Criteria:
Trendline Break and retest of minor resistance near 1.9016 on 1H
Candle close above 1H EMA50 and trendline break confirmation
Bullish engulfing or momentum candle off support area
⚠️ Risk Management:
Risk per trade: 1% of account
Trade invalidation if: Price closes below 1.89698 on 4H with bearish momentum