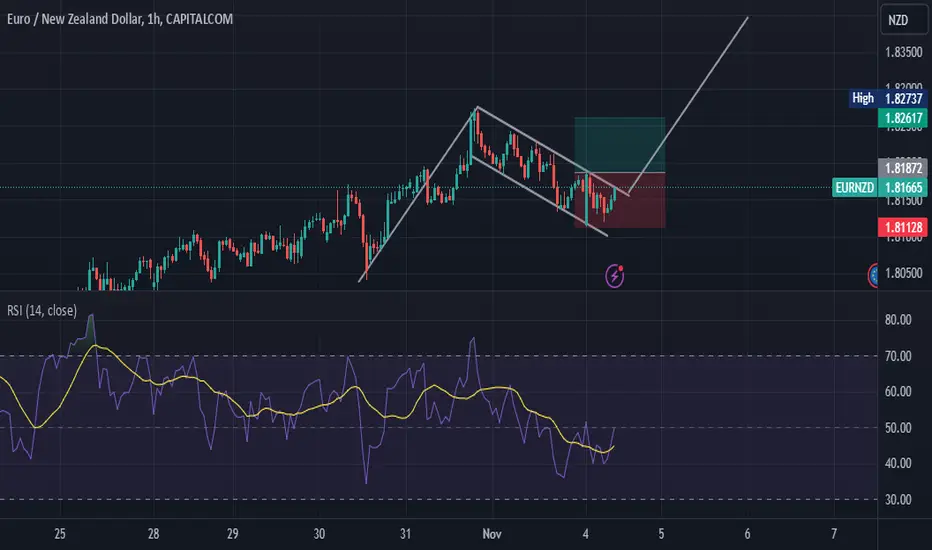
EURNZD Targeting Higher LevelsPrice is showing bullish RSI divergence at a key support level (green zone).
I expect at least a short term recovery, initially targeting blue resistance, and then gray long term resistance.
EURNZD trade ideas

EURNZD SELLEURNZD has made a bearish flag pattren on 15min, so we eneter in the trade by placing the sell stop and then place the sl above the last range high and wit for our marked target.... hope this trade will go as we marked inshallhaa

EURNZD - LONG or SHORT - Who gues?Hello. Who knows EURNZD LONG or SHORT?
Couple of days waiting for decision.
Lets see.
Trade safely. Do not be so greedy?
Good Luck.

EurNzd WEEKLY Buys?WEEKLY: Just tapped WEEKLY Demand Zone looking for bullish momentum to break on 3MIN, 30MIN, and 4HR charts.
4HR: Still Bearish but expecting a close above 1.79826 to feel comfortable holding for swing.
30MIN: Currently breaking above previous high of 1.78695 looking for close in next 5min.

RR=2 buy ideabullish crab pattern + RSI divergence + double bootom pattern + five eliot impulsive waves count : we might be at the beginning of formation of first leg of correction wave
PS never risk more than 2% of your capital per trade

eurnzd buy signal. Don't forget about stop-loss.
Write in the comments all your questions and instruments analysis of which you want to see.
Friends, push the like button, write a comment, and share with your mates - that would be the best THANK YOU.
P.S. I personally will open entry if the price will show it according to my strategy.
Always make your analysis before a trade

EURNZD Short Term Sell IdeaH1 - Bearish trend pattern
Strong bearish momentum
Until the strong resistance zone holds I expect the price to move lower further after pullbacks.


EURNZD SCALP FOR A BUY EURNZD is gaining upward momentum, signaling a strong buying trend. Traders may look for entries on pullbacks, targeting short-term gains as the pair continues to rise.

A new idea nor a setup for the EURNZD!A new idea or a setup for the EURNZD could involve analyzing recent price action and identifying key support and resistance levels. Consider looking for potential entry points based on technical analysis. Watching economic news that could impact the Euro and New Zealand Dollar might also be useful. A clear risk management strategy is crucial to protect against adverse movements.


EurNzd Weekly Buys?WEEKLY: Has retraced into supply zone waiting for lower time frame momentum to show bullish volume.
Need confirmations on 3min/30min to hold for WEEKLY swing trade.

EUR_NZD LONG FROM SUPPORT|LONG|
✅EUR_NZD is going down now
But a strong support level is ahead at 1.7833
Thus I am expecting a rebound
And a move up towards the target at 1.7904
LONG🚀
✅Like and subscribe to never miss a new idea!✅

EURNZD: Long Signal Explained
EURNZD
- Classic bullish formation
- Our team expects pullback
SUGGESTED TRADE:
Swing Trade
Long EURNZD
Entry - 1.7868
Sl - 1.7801
Tp - 1.8005
Our Risk - 1%
Start protection of your profits from lower levels
❤️ Please, support our work with like & comment! ❤️

EurNzd SellsOANDA:EURNZD Nice Sell opportunity, great risk to reward, Please don't over leverage, I am not Fsca regulated this is my personal views and bias, not providing trading signals.

EUR/NZD H4 | Potential bullish bounceEUR/NZD is falling towards a pullback support and could potentially bounce off this level to climb higher.
Buy entry is at 1.7858 which is a pullback support.
Stop loss is at 1.7758 which is a level that lies underneath an overlap support.
Take profit is at 1.8063 which is an overlap resistance.
High Risk Investment Warning
Trading Forex/CFDs on margin carries a high level of risk and may not be suitable for all investors. Leverage can work against you.
Stratos Markets Limited (www.fxcm.com):
CFDs are complex instruments and come with a high risk of losing money rapidly due to leverage. 64% of retail investor accounts lose money when trading CFDs with this provider. You should consider whether you understand how CFDs work and whether you can afford to take the high risk of losing your money.
Stratos Europe Ltd (www.fxcm.com):
CFDs are complex instruments and come with a high risk of losing money rapidly due to leverage. 66% of retail investor accounts lose money when trading CFDs with this provider. You should consider whether you understand how CFDs work and whether you can afford to take the high risk of losing your money.
Stratos Trading Pty. Limited (www.fxcm.com):
Trading FX/CFDs carries significant risks. FXCM AU (AFSL 309763), please read the Financial Services Guide, Product Disclosure Statement, Target Market Determination and Terms of Business at www.fxcm.com
Stratos Global LLC (www.fxcm.com):
Losses can exceed deposits.
Please be advised that the information presented on TradingView is provided to FXCM (‘Company’, ‘we’) by a third-party provider (‘TFA Global Pte Ltd’). Please be reminded that you are solely responsible for the trading decisions on your account. There is a very high degree of risk involved in trading. Any information and/or content is intended entirely for research, educational and informational purposes only and does not constitute investment or consultation advice or investment strategy. The information is not tailored to the investment needs of any specific person and therefore does not involve a consideration of any of the investment objectives, financial situation or needs of any viewer that may receive it. Kindly also note that past performance is not a reliable indicator of future results. Actual results may differ materially from those anticipated in forward-looking or past performance statements. We assume no liability as to the accuracy or completeness of any of the information and/or content provided herein and the Company cannot be held responsible for any omission, mistake nor for any loss or damage including without limitation to any loss of profit which may arise from reliance on any information supplied by TFA Global Pte Ltd.
The speaker(s) is neither an employee, agent nor representative of FXCM and is therefore acting independently. The opinions given are their own, constitute general market commentary, and do not constitute the opinion or advice of FXCM or any form of personal or investment advice. FXCM neither endorses nor guarantees offerings of third-party speakers, nor is FXCM responsible for the content, veracity or opinions of third-party speakers, presenters or participants.

Eurnzd for short.Price formed a rising wedge and broke below it. Wait for current candle fo form before taking entry.

EURNZD (Bullish)As u see Market structure and bearish trendline has been broken we are in bull market also price pull backed on strong demand zone so expect big bullish movements soon.

EURNZD Bullish Flag Pattern: Breakout Potential AheadEUR/NZD is forming a bullish flag pattern, a classic continuation setup signaling potential upside momentum. After a strong initial rally, price has entered a consolidation phase, creating a well-defined flag. With the support of this structure, we could see a breakout that aligns with broader bullish momentum.
EURNZD Bearish AB=CD Setup at 0.50 Fib LevelEURNZD is showing strong bearish potential setup as it approaches the key 0.50 Fib level.

EURNZD - ShortThe chart is making Lower Highs and Lower Lows hence in Bearish Trend. There is no divergence on RSI so there is a chance of continuation of the following trend till the support zone.

EURNZD WILL GROW BUY Take a look at our analysis for EURNZD.
The market is appoarching a significant support area 1.795
The underline horizontal cluster clearly indicates a highly probable bullish movement
with target 1.822 level

EURNZD Will Grow! Buy!
Take a look at our analysis for EURNZD.
Time Frame: 1D
Current Trend: Bullish
Sentiment: Oversold (based on 7-period RSI)
Forecast: Bullish
The market is approaching a significant support area 1.795.
The underlined horizontal cluster clearly indicates a highly probable bullish movement with target 1.822 level.
P.S
The term oversold refers to a condition where an asset has traded lower in price and has the potential for a price bounce.
Overbought refers to market scenarios where the instrument is traded considerably higher than its fair value. Overvaluation is caused by market sentiments when there is positive news.
Like and subscribe and comment my ideas if you enjoy them!
