Next report date
—
Report period
—
EPS estimate
—
Revenue estimate
—
1.88 EUR
138.67 M EUR
4.42 B EUR
127.00 M
About SBM OFFSHORE
Sector
Industry
CEO
Øivind Tangen
Website
Headquarters
Schiphol
Founded
1965
ISIN
NL0000360618
FIGI
BBG000BC4NF9
SBM Offshore NV provides floating production solutions to the offshore energy industry. It operates through the Lease and Operate, and Turnkey segments. The Lease and Operate segment are focused on all-day rates earned on long-term operating leases and operating contracts. The Turnkey segment consists of revenues from Turnkey supply contracts and after-sales services. The company was founded in 1965 and is headquartered in Schiphol, the Netherlands.
Related stocks


Long SBM OffshoreLong SBM Offshore
- New uptrend started
- Close above 150EMA > rejected, but managed to close above again + break the swing high.
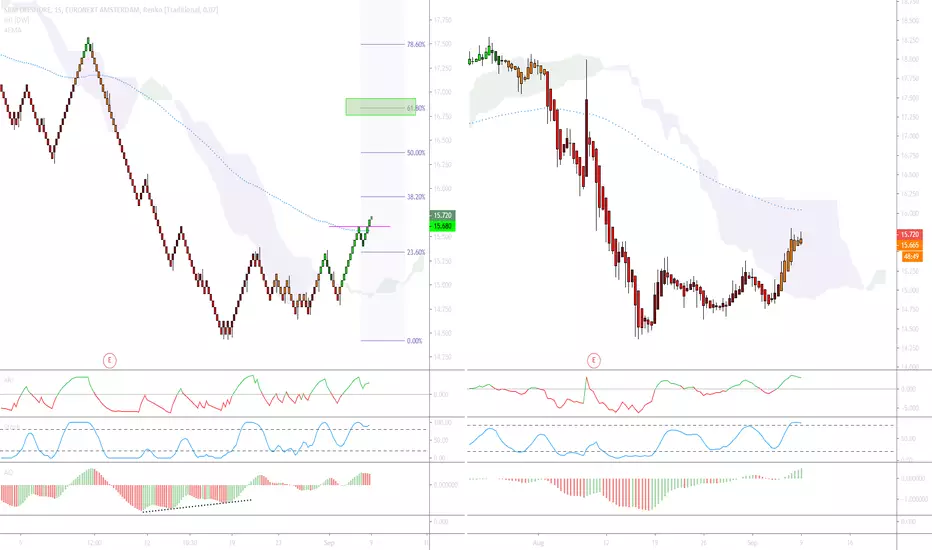


SBM offshore lets wait for another move UPI think the stock market has alot to offer for now, now this is my EW count SBM offshore, lets see how it turns out


See all ideas
Summarizing what the indicators are suggesting.
Neutral
SellBuy
Strong sellStrong buy
Strong sellSellNeutralBuyStrong buy
Neutral
SellBuy
Strong sellStrong buy
Strong sellSellNeutralBuyStrong buy
Neutral
SellBuy
Strong sellStrong buy
Strong sellSellNeutralBuyStrong buy
An aggregate view of professional's ratings.
Neutral
SellBuy
Strong sellStrong buy
Strong sellSellNeutralBuyStrong buy
Neutral
SellBuy
Strong sellStrong buy
Strong sellSellNeutralBuyStrong buy
Neutral
SellBuy
Strong sellStrong buy
Strong sellSellNeutralBuyStrong buy
Displays a symbol's price movements over previous years to identify recurring trends.
Frequently Asked Questions
The current price of SBMO is 21.62 EUR — it has decreased by −0.09% in the past 24 hours. Watch SBM OFFSHORE stock price performance more closely on the chart.
Depending on the exchange, the stock ticker may vary. For instance, on EURONEXT exchange SBM OFFSHORE stocks are traded under the ticker SBMO.
SBMO stock has fallen by −3.89% compared to the previous week, the month change is a −6.62% fall, over the last year SBM OFFSHORE has showed a 32.15% increase.
We've gathered analysts' opinions on SBM OFFSHORE future price: according to them, SBMO price has a max estimate of 34.95 EUR and a min estimate of 23.97 EUR. Watch SBMO chart and read a more detailed SBM OFFSHORE stock forecast: see what analysts think of SBM OFFSHORE and suggest that you do with its stocks.
SBMO reached its all-time high on Jul 24, 2007 with the price of 30.06 EUR, and its all-time low was 7.58 EUR and was reached on Nov 20, 2012. View more price dynamics on SBMO chart.
See other stocks reaching their highest and lowest prices.
See other stocks reaching their highest and lowest prices.
SBMO stock is 0.84% volatile and has beta coefficient of 0.95. Track SBM OFFSHORE stock price on the chart and check out the list of the most volatile stocks — is SBM OFFSHORE there?
Today SBM OFFSHORE has the market capitalization of 3.74 B, it has decreased by −5.13% over the last week.
Yes, you can track SBM OFFSHORE financials in yearly and quarterly reports right on TradingView.
SBM OFFSHORE is going to release the next earnings report on Feb 26, 2026. Keep track of upcoming events with our Earnings Calendar.
SBMO net income for the last half-year is 294.82 M EUR, while the previous report showed 31.41 M EUR of net income which accounts for 838.67% change. Track more SBM OFFSHORE financial stats to get the full picture.
Yes, SBMO dividends are paid annually. The last dividend per share was 0.86 EUR. As of today, Dividend Yield (TTM)% is 3.97%. Tracking SBM OFFSHORE dividends might help you take more informed decisions.
SBM OFFSHORE dividend yield was 5.07% in 2024, and payout ratio reached 110.87%. The year before the numbers were 6.15% and 30.19% correspondingly. See high-dividend stocks and find more opportunities for your portfolio.
As of Aug 12, 2025, the company has 6.42 K employees. See our rating of the largest employees — is SBM OFFSHORE on this list?
EBITDA measures a company's operating performance, its growth signifies an improvement in the efficiency of a company. SBM OFFSHORE EBITDA is 1.14 B EUR, and current EBITDA margin is 20.34%. See more stats in SBM OFFSHORE financial statements.
Like other stocks, SBMO shares are traded on stock exchanges, e.g. Nasdaq, Nyse, Euronext, and the easiest way to buy them is through an online stock broker. To do this, you need to open an account and follow a broker's procedures, then start trading. You can trade SBM OFFSHORE stock right from TradingView charts — choose your broker and connect to your account.
Investing in stocks requires a comprehensive research: you should carefully study all the available data, e.g. company's financials, related news, and its technical analysis. So SBM OFFSHORE technincal analysis shows the sell today, and its 1 week rating is buy. Since market conditions are prone to changes, it's worth looking a bit further into the future — according to the 1 month rating SBM OFFSHORE stock shows the buy signal. See more of SBM OFFSHORE technicals for a more comprehensive analysis.
If you're still not sure, try looking for inspiration in our curated watchlists.
If you're still not sure, try looking for inspiration in our curated watchlists.