ADP weekly Buy SetupLIke this one on the weekly chart. The only think I don't like is the 20MA. I wish it was stronger.
Otherwise, very nice.
4ADP trade ideas

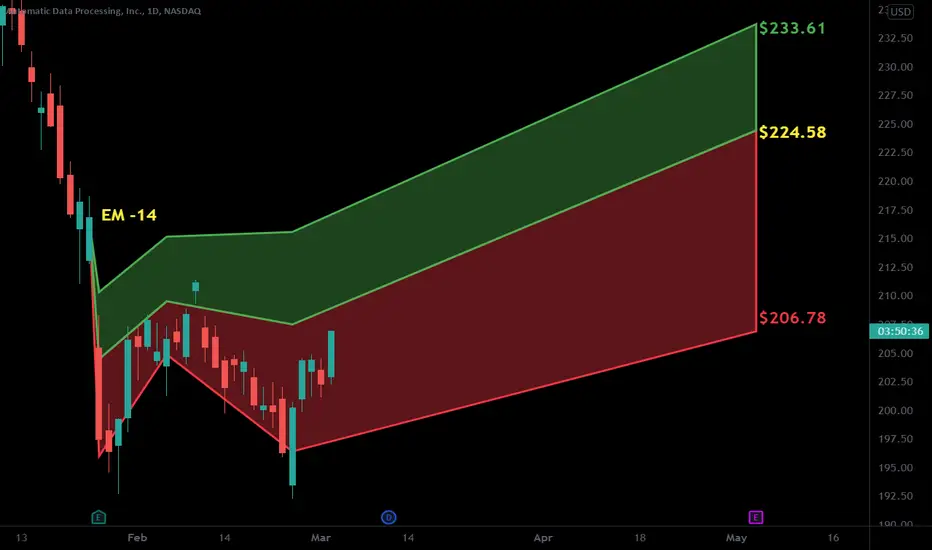
TOP US-Stocks: Buy-Signal ADPThe stock just broke through a perfect buy point and triggered a buy-signal. The stop loss level and profit target are shown in the graphic.
All stocks on our watchlists meet the hard selection criteria according to Mark Minervini's Trend-Template and William o' Neil's CAN SLIM methodology AND
are in the process of developing a Perfect Buy Point and a low-risk entry, following a volatility contraction pattern.
The stock just broke through a perfect buy point and triggered a buy-signal. The stop loss level and profit target are shown in the graphic.
🍾🍾 We trade like the Champions 🍾🍾
Are you struggling with your trading strategy? Follow me to get free, real-time trading signals which are all based on Mark Minervini's success-proven strategy.

BUY IDEA: Automatic Data ProcessingAn idea published earlier today on our client platform:
Strong technical structure supported by better-than-expected Q1 2023 results (Revenue and Earnings exceeding analyst expectations). Expecting a moderate retracement followed by further upside momentum.
TRADING LEVELS:
Entry: 243.64
Target: 275.00
Stop-loss: 225.00
For more research insights, including trade ideas, get in touch today.

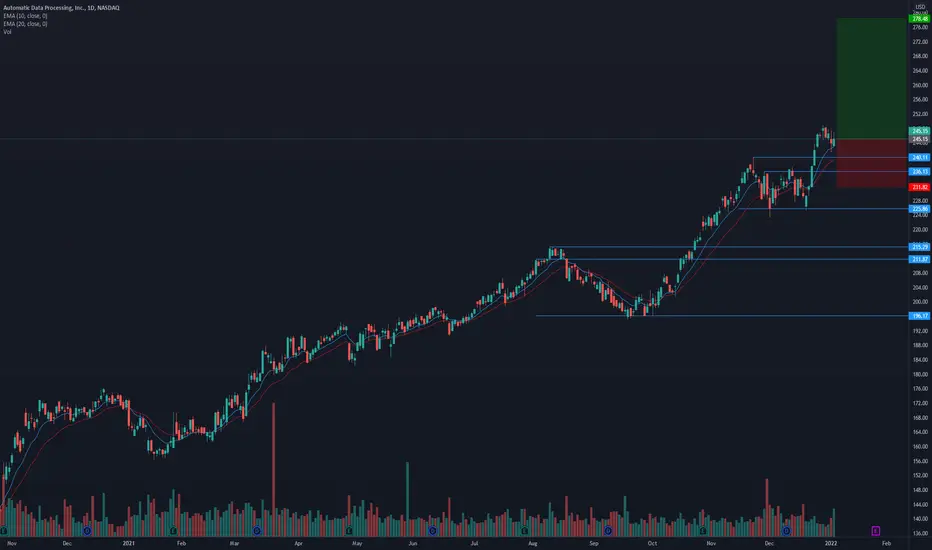
ADP Could Be Fighting HigherOne of the remarkable things about the current economy is the resilience of the labor market. Today’s chart focuses on a key name in that field: payroll giant Automatic Data Processing.
Consider how ADP troughed below $195 in January and February. Its next low in June was slightly above that level. Then on October 13 as the broader market tanked, this stock bounced above $215. Those higher lows could reveal the presence of an uptrend.
Next is the surge to new all-time highs in August following a strong quarterly report. That rally broke a trendline running along the highs of January of April. ADP pulled to back to hold the same line this month. Old resistance becomes new support.
Third, ADP has touched its 50-, 100- and 200-day simple moving averages (SMAs) in the last three weeks. The proximity of those lines to each other demonstrates how much the stock has consolidated in the last year. Interestingly, the three returned to a bullish sequence (with the fastest on top) in mid-August.
If that suggests the longer-term trend remains positive, the last pattern could show the shorter-term trend moving similarly. Our 2 MA Ratio custom script at the bottom shows the 8-day exponential moving average (EMA) as a ratio versus the 21-day EMA. Notice how the most recent jump pushed the faster EMA above the slower EMA.
TradeStation has, for decades, advanced the trading industry, providing access to stocks, options, futures and cryptocurrencies. See our Overview for more.
Important Information
TradeStation Securities, Inc., TradeStation Crypto, Inc., and TradeStation Technologies, Inc. are each wholly owned subsidiaries of TradeStation Group, Inc., all operating, and providing products and services, under the TradeStation brand and trademark. You Can Trade, Inc. is also a wholly owned subsidiary of TradeStation Group, Inc., operating under its own brand and trademarks. TradeStation Crypto, Inc. offers to self-directed investors and traders cryptocurrency brokerage services. It is neither licensed with the SEC or the CFTC nor is it a Member of NFA. When applying for, or purchasing, accounts, subscriptions, products, and services, it is important that you know which company you will be dealing with. Please click here for further important information explaining what this means.
This content is for informational and educational purposes only. This is not a recommendation regarding any investment or investment strategy. Any opinions expressed herein are those of the author and do not represent the views or opinions of TradeStation or any of its affiliates.
Investing involves risks. Past performance, whether actual or indicated by historical tests of strategies, is no guarantee of future performance or success. There is a possibility that you may sustain a loss equal to or greater than your entire investment regardless of which asset class you trade (equities, options, futures, or digital assets); therefore, you should not invest or risk money that you cannot afford to lose. Before trading any asset class, first read the relevant risk disclosure statements on the Important Documents page, found here: www.tradestation.com .

$ADP with a Bullish outlook following its earnings #Stocks The PEAD projected a Bullish outlook for $ADP after a Positive over reaction following its earnings release placing the stock in drift B with an expected accuracy of 28.57%.

ADP Unemployment Broader MarketsIf I take a look at the chart of ADP, along with the development of the broader markets (those charts not captured), I'd be on the hook to look at the Unemployment Rate being at the consensus of 3.7%; however, it it comes in at 3.5% as it did in August (where it referenced July), then you could see some buying pressure -- nevertheless, I'd be looking at shorting opportunities into any bullish movements (that is just me).
U.S. Dollar continues to be strong with Energy and Treasury Rates, while Financials remain weak.
All-in-all, the thought of the markets 'skyrocketing' are just not in the cards for me. I think we're setting up for an October 4th retest of those lows.
2022-08-05 Reference Jul Actual 3.5% Previous 3.6% Consensus 3.6%
2022-09-02 Reference Aug Actual 3.7% Previous 3.5% Consensus 3.5%
2022-10-07 Reference Sep Actual (TBD) Previous 3.7% Consensus 3.7%

Buy Adp@ $260 Target $300 Mar 2023Automatic Data Processing (Value Stock)
Technial Anaylsis
1. Uptrending 52 week high $250
2. Break out of resistance
3. May pull-back toward $250
4. Ideal Entry $260 / $250 Cost averaging
5. Target@ $300 Mar 31, 2023 to complete cycle
Fundamental Description:
ADP offers industry-leading online payroll and HR solutions, plus tax, compliance, benefit administration and more.
Company website: www.adp.com
(For Speculation Purposes)

$ADP with a Bullish outlook following its earnings #Stocks The PEAD projected a Bullish outlook for $ADP after a Positive Under reaction following its earnings release placing the stock in drift A with an expected accuracy of 100%.

Long $ADP from 203,5ADP has been in a nice uptrend from Covid bottom. My bet is that it will bounce from bottom trend line and target is ATH. SL just below previous bottom and will trigger for reversal of trend.
R/R ratio: 3,62

$ADP with a Bullish outlook following its earnings #Stocks The PEAD projected a Bullish outlook for $ADP after a Positive Under reaction following its earnings release placing the stock in drift A with an expected accuracy of 100%.
Automatic Data Processing ADP - Short Setup on WeeklyADP broke uptrend on weekly, returning for confirmation of downtrend. Risk/reward in the red zone is very good.

Automatically down on ADP.Goals 193, 179, 170. Invalidation at 244.
We are not in the business of getting every prediction right, no one ever does and that is not the aim of the game. The Fibonacci targets are highlighted in purple with invalidation in red. Fibonacci goals, it is prudent to suggest, are nothing more than mere fractally evident and therefore statistically likely levels that the market will go to. Having said that, the market will always do what it wants and always has a mind of its own. Therefore, none of this is financial advice, so do your own research and rely only on your own analysis. Trading is a true one man sport. Good luck out there and stay safe

$ADP with a Bullish outlook following its earnings #Stocks
The PEAD projected a Bullish outlook for $ADP after a Negative under reaction following its earnings release placing the stock in drift D with an expected accuracy of 100%.
LONG ADPStrong Stock making a pullback off of high volume profile and a double bottom, with an oversold RSI and IBS

ADP looking to head higher prior to earnings?Note:
I last mentioned this around late October 2021.
Since then it's gone up and consolidated while the rest of the market was turning down.
This shows institutional support technically and it's also doing really well fundamentally.
* Amazing earnings quarter over quarter
* Incredibly strong long term up trend
* High 3-month relative strength of 2.64 in the Industrial sector
* Broke out of a roughly month long base last week
* Came back down to a buying range and now increasing in volume again
Trade idea:
* Right now's a good time to enter as it's using it's 10 EMA as support.
* It's 2.1% above the broken resistance which is still very close
* Offering a great risk to reward ratio
* If you're looking for a better entry, you can look for an opportunity near the $240.11 area
Caution:
* A break below $236.13 would negate this idea.
$ADP - Calls > 230.5 | Puts < 228$ADP - Calls > 230.5 | Puts < 228
- Bull pennant formed
- Weekly Outside bar
- Holding weekly 10 ema
- Weekly Levels posted in chart

ADPthe allotted area is somewhat embarrassing, but a move up to 250 is still possible. Too aggressive XLK

ADP broke out and is picking up volume!* Exceptional earnings
* Very strong up trend
* High RS in the Industrials sector
* Breaking out of a ~12 week well rounded base
* Picking up on volume

$ADP - LongMultiple buy signals on ADP.
Long from here.
SL TBC.
82% win rate, profit factor of 17:1.


LONG (IF BUYERS ARE ON LVL) 1D closed > 179.89
I am expecting long impulse.
Scenario will be cancelled, if 1D close < 179.89

