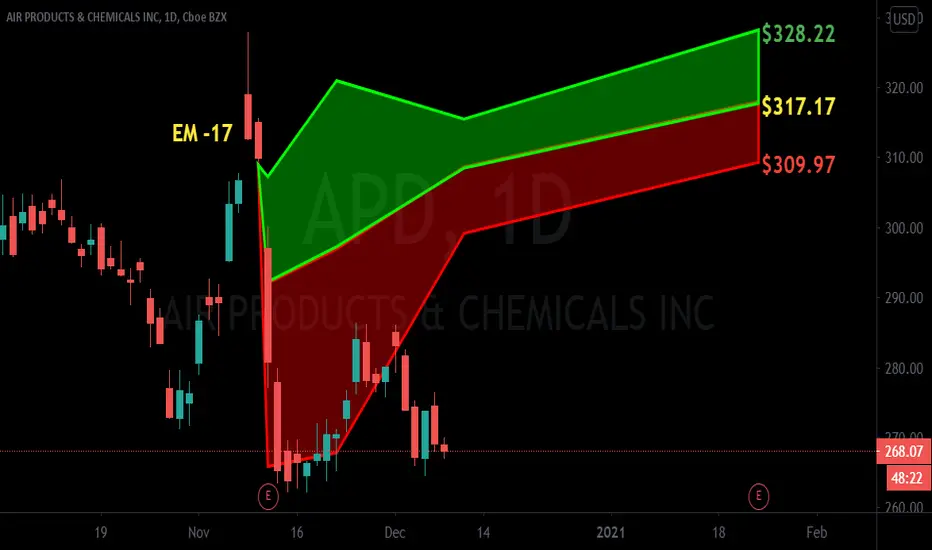
$APD with a Bullish outlook following its earnings #Stocks The PEAD projected a Bullish outlook for $APD after a Positive under reaction following its earnings release placing the stock in drift A
If you would like to see the Drift for another stock please message us. Also click on the Like Button if this was useful and follow us or join us.
4APD trade ideas

APD repeating yearly pattern, golden cross into bull run??Hi. In this 1D chart I've plotted out the price increase of 2019 and 2020, marked their golden crosses in the first halves of the year and placed the resistance line from 2020 that the current golden cross could indicate will result in the price breaking through and rising past it during this year.
Keep in mind that the fundamentals of APD are also very good.
Thank you. Please if you have any thoughts or comments do leave them below and I would gladly discuss or adjust my interpretations and methods.
This does not constitute financial advice.
Any prices, even if explicitly stated, are presented with intent to discuss the symbol and potential interpretations.
Any trades shown or mentioned are examples and neither recommendations or mandates.

APD inter market analysis ➡️Pattern recognized:
Running flat
➡️Hypothesis:
Bearish
➡️Catalyst:
Earnings in 16 days. I expect a drop followed by a rally in anticipation to earnings.
➡️Conclusion:
Buy puts once it break the 288 price alert
***This does not constitute financial advice.***
If you like what you see why not support us?
👇

Buy Air Product at 262 stoploss 245 takeprofit at 3RBuy Air Product at 262, stoploss 245, takeprofit at 3R


Looks like no-brainer, what am i missing?Solid company
Analyst recommend very much. fundamentals are reasonable. Expected to grow EPS annually 9% for next 5 years and 14% next year. pays dividend. solid quick ratio, solid current ratio.
Price is at support
what else do would you need to know before hitting that buy button

APD - Added to the Watchlish looks promising!Looks to be at the bottom of its channel and about to become bullish again. Add to your watchlists =]

Pull Back FishingAPD screwed up earnings and missed on EPS.
Bearish divergence on rsi after head and shoulders top..
Just watching/Not a recommendation

APD - EW analysis - ABC zigzag down APD - It seems like the impulse cycle completed at the major top and now correcting down. The down move is so far ABC zigzag down and B is in progress as flat correction abc. Sell once the B wave finished with new high as 5th internal wave of final sequence for down cycle of C wave.
Give thumbs up if you really like the trade idea.

Falling WedgeAll in all, this chart does not look good..lol
moving averages are out of order..the 50 is under the 100.
But a falling wedge can be bullish and can serve as a reversal pattern. At he bottom it is pointed in the direction of the trend, downward. At the top is tilts countertrend. It is a longer formation (at least 3 weeks to form) than a flag, plus it often lacks a flag pole. This formation is just over 15 trading days. Both trendlines point downward and converge at the apex,
Possible H&S top
Just an observation.
NV is high on this one/Negative volume is volume on down days...and is when larger players often buy.
OBV/on balance volume is also high. Short is on the low side
shortsqueeze.com
The market does not form chart patterns, psychology does


$APD with a slight bullish outlook following earning releaseThe PEAD projected a slight bullish outlook following $APD earning release with a negative under reaction, placing the stock in Drift D
If you would like to see the Drift for another stock please message us. Also click on the Like Button if this was useful and follow us or join us.


BUY for AIR PRODUCTS & CHEMICALSHey people, My AIR PRODUCTS & CHEMICALS projections refusal of the buyers in the stabilization zone, plausible that he seeks to make a pull back and rewind to let breathe.
Please LIKE & FOLLOW, thank you!

APD broke through 200 day moving average on May 5If you bought APD out the bottom downtrend you could of scored a 25% gain. It broke through the 200 day moving average of 223.21

Long on $APDHello Everyone,
We are going Long $APD, It is currently showing a stong set up relative to the market and we believe that is could rally . We have set a price target at $237.23 and plan on putting a sell signal at that price. For safety measures, we have incorporated a stop loss at $194.66.
Best of Luck,
Tashua Financial

