Head and Shoulders on BAHello traders this is my analysis for ticker symbol NYSE:BA .
Two possible scenarios that can play out this week.
First scenarios market has a bull rally tomorrow morning which I will be looking for a reject in the area of 130 - 132.86 this will complete the right shoulder confirming this pattern and will be shorting after it breaks the neckline 126.89
Second scenario market opens and breaks the 126.89 level and we will head down to the downside.
This is just my idea would love to hear from you guys and your analysis on BA
4BA trade ideas

BOENG, 50 years of BULL MARKET is about to endhello friends,
"first of all i would like to clarify this analysis is only a personal opinion and it could be wrong more than right, so please if you disagree with it that's totally fine i am just sharing what i have learnt and experienced
So back to Boeing , the lovely BOEING has been in a bull market for almost 50 years, we can see that the stock completed 5 waves started back in the 70s and price dropped sharply in 2020 after whales distribution took place between 2018-2019:
lets have a look at the detailed waves since the last drop:
it is clear that the previous bullrun was an ABC correction to the upside for the huge drop in early 2020 ( counter trend reaction ) and it was not a an impulsive 5 wave.
keeping in mind DJI and SPX at all time high. Regarding the global atmosphere everything seems fine and stable as the vaccination process is taking place, i don't know what bad news is coming to crash the market but maybe any fail of the vaccine would hit the market so strong. I personally in the market but tight stop loss is a must as optimism is sky rocketing. i never trust the market and i always trade cautiously. finally never underestimate the impact of Covid19 on the economy
another scenario is we still have wave 5 to be completed around 400$ - 500$

BA Lovely bearish Divergence + bearish megaphone BA Lovely bearish Divergence + bearish megaphone today from top 142.21 target 135 -130


BA inside a rectangleA couple of things to track on BA
1- Ascending triangle on the hourly chart with resistance at 141.40. This level has rejected many times now. Above that we could start moving higher towards 143.40
2- There is a rectangle that has formed while consolidating sideways with the same resistance level 141.40
I will be watching this name to see in which direction it will resume.

Boeing could soarI think Boeing is oversold.
Purely technical play as $BA is seeing buy volume coming in -- right off the fib level shown.
Oscillators look well defined.
Stochastic may be showing a need of a retrace.
but I am watching for the fib support at 130 to hold.
Timing likely depends on overall market.
Range* low.
Swing.

Boeing Boeing shares soar after Starliner!
The value of Boeing's shares after the successful launch of the Starliner spacecraft rushed up, testing the level of technical support of $118 per share on the New York Stock Exchange. This level is historical, which was recorded in 2020. One of the factors that investors are interested in buying Boeing shares and forming a medium-term trend of stable demand is the publication of optimistic macroeconomic statistics published by the US Department of Commerce, which gives grounds for the growth of the share price to $145 per share. In the event of a breakdown of the resistance level of $145 and successful consolidation above this value, the opportunity opens up to test the levels of $160 and $185 per share by the end of 2022 and continue the growth of the company's total income from 2020.

Boeing at Long Term Support -70% $BA AnalysisBoeing looks like a good long term buy and hold. Currently down over 70% from ATH.
I may buy this. Will update if I do.

BA RallyBA bouncing off the last demand zone from covid lows. Primed for a rally to 150-180 area. SL would be 118.

BA PUTS Looking for a pullback then looking to hop into puts as soon as we get a clear rejection from the pull back or a clear break for new monthly lows

Boeing USA Sun Storm Investment Trading Desk & NexGen Wealth Management Service Present's: SSITD & NexGen Portfolio of the Week Series
Focus: Worldwide
By Sun Storm Investment Research & NexGen Wealth Management Service
A Profit & Solutions Strategy & Research
Trading | Investment | Stocks | ETF | Mutual Funds | Crypto | Bonds | Options | Dividend | Futures |
USA | Canada | UK | Germany | France | Italy | Rest of Europe | Mexico | India
Disclaimer: Sun Storm Investment and NexGen are not registered financial advisors, so please do your own research before trading & investing anything. This is information is for only research purposes not for actual trading & investing decision.
#debadipb #profitsolutions

BOEING WOLFE WAVE SETUP CONSIDER FOR WATCHLIST FOR BUY TRIGGERSThere is a wolfe wave setup on the daily time frame. The projected target is calculated by extending a linear line between pivot 1 and 4. This is represented as the green perforated line, as shown in the chart. The projected target is 296 which is expected to reach this price target near June 2023.

Boeing (NYSE: $BA) Looks Ready To FLY High ✈️The Boeing Company, together with its subsidiaries, designs, develops, manufactures, sales, services, and supports commercial jetliners, military aircraft, satellites, missile defense, human space flight and launch systems, and services worldwide. The company operates through four segments: Commercial Airplanes; Defense, Space & Security; Global Services; and Boeing Capital. The Commercial Airplanes segment provides commercial jet aircraft for passenger and cargo requirements, as well as fleet support services. The Defense, Space & Security segment engages in the research, development, production, and modification of manned and unmanned military aircraft and weapons systems; strategic defense and intelligence systems, which include strategic missile and defense systems, command, control, communications, computers, intelligence, surveillance and reconnaissance, cyber and information solutions, and intelligence systems; and satellite systems, such as government and commercial satellites, and space exploration. The Global Services segment offers products and services, including supply chain and logistics management, engineering, maintenance and modifications, upgrades and conversions, spare parts, pilot and maintenance training systems and services, technical and maintenance documents, and data analytics and digital services to commercial and defense customers. The Boeing Capital segment offers financing services and manages financing exposure for a portfolio of equipment under operating leases, sales-type/finance leases, notes and other receivables, assets held for sale or re-lease, and investments. The company was incorporated in 1916 and is based in Chicago, Illinois.

Is Boeing losing ?www.cnbc.com
Wow. Firing of a CEO could help the share price to jack up by 3%! So, in a Company, the CEO is crucial, his or her words provide confidence to the investors and apparently the outgoing CEO has failed in this aspect.
Chart wise, I see 2 possibilities though I am not quite optimistic that the share price would continue its upward trajectory from here. Rather, I think it is likely for it to further fall to around 294.75 where it meets its support before a rebound.
I am putting this stock in my watch list and are neutral at this juncture.

Possible short term rebound to $146 then $157The Boeing Co. is an aerospace company, which engages in the manufacture of commercial jetliners and defense, space, and security systems. It operates through the following segments: Commercial Airplanes, Defense, Space and Security, Global Services, and Boeing Capital. The Commercial Airplanes segment includes the development, production, and market of commercial jet aircraft and provides fleet support services, principally to the commercial airline industry worldwide. The Defense, Space and Security segment refers to the research, development, production and modification of manned and unmanned military aircraft and weapons systems for global strike, including fighter and combat rotorcraft aircraft and missile systems, global mobility, including tanker, rotorcraft and tilt-rotor aircraft, and airborne surveillance and reconnaissance, including command and control, battle management and airborne anti-submarine aircraft. The Global Services segment provides services to commercial and defense customers. The Boeing Capital segment seeks to ensure that Boeing customers have the financing they need to buy and take delivery of their Boeing product and manages overall financing exposure. The company was founded by William Edward Boeing on July 15, 1916, and is headquartered in Chicago, IL.

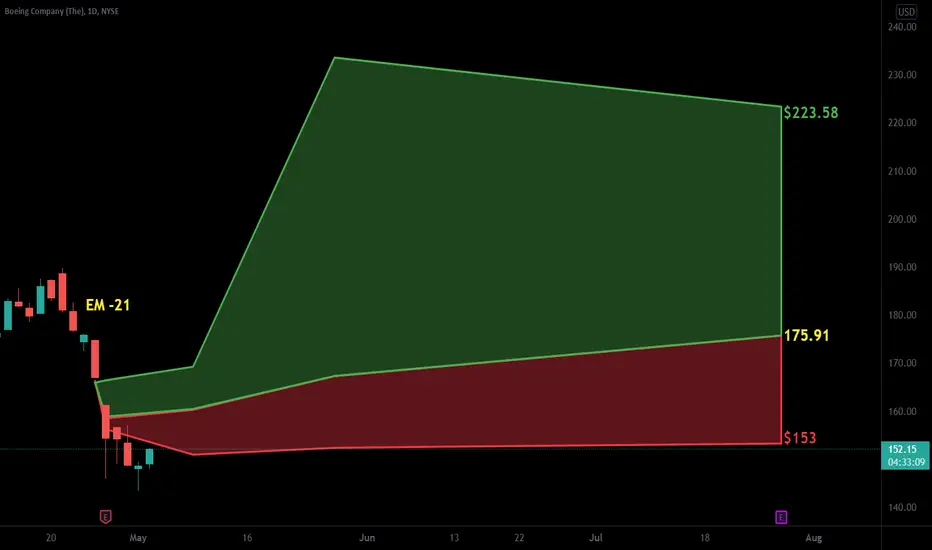
BA-BUY strategythe share price starts looking to bottom and we are likely going to gravitate towards the top of the angle (blue area) in time.
I suggest BUY 125-130 and take profit 150-155 for now. Stop-loss if required @ 105.00

BA - Target $75Fat inverse cup and handle.
First taget 113.
Next 100.
If that does not hold, should see 75 real soon.

5/11/22 BABoeing Company (The) ( NYSE:BA )
Sector: Electronic Technology (Aerospace & Defense)
Market Capitalization: $78.658B
Current Price: $132.95
Breakdown price: $130.20
Sell Zone (Top/Bottom Range): $167.05-$143.75
Price Target: $92.00-$90.90
Estimated Duration to Target: 129-137d
Contract of Interest: $BA 8/19/22 125p
Trade price as of publish date: $10.30/contract

How I trade BA This video covers my BA trading strategy.
I get many requests on what my trading style looks like (as a quant trader), so I figured I would show how I trade BA, as this particular strategy is replicable and the tools I use are publicly available (linked below).
NOTE:
This isn't financial advice.
As well, my signal to long BA is always a Z Score of -2.6.
However, my signal to short BA changes based on the market sentiment. Currently, it is -1, however for the most part of 2021 and up until last month it was set at -0.5 to 0. In general, I DO NOT recommend shorting a stock with a Z-Score of -1. It is high risk.
Its important when you are applying any strategy to back-test it first!
As well, this strategy is applicable to other stocks; however, its important to get a feel for how the Z-Score behaves as each stock is unique. For example, TSLA I have seen go as low as a -4 Z Score and as high as a +4.4 Z Score. The parameters I share in this video are my current parameters for BA but are subject to change as the sentiment changes.
Let me know your questions/comments and criticisms below!
Thanks for watching

$BA with a Bullish outlook following its earnings #Stocks The PEAD projected a Bullish outlook for $BA after a Negative Under reaction following its earnings release placing the stock in drift D with an expected accuracy of 66.67%.
BA at Great SupportDrop after earning and retest support at $145 and if it holds above it we could see upward momentum.

Boeing Company SHORT Trade IdeaBA has triggered a SHORT opportunity based on a weekly price settlement.
I've indicated the area to sell, the stop above and the target below.

BA TRADE LOGICTook a $BA $150 P position before the market closed today and making a note of why I ultimately made the trade.
1. Earnings catalyst (obviously).
2. Been trading with a downward channel but broke the channel even more to the downside.
3. After breaking the downtrend $BA entered a gap made back in November 2020 from $172ish to $158/9ish (blue lines).
4. If I read my research correctly $BA hasn't turned a profit on earning in like 3 or 4 quarters and will probably miss again. With the market acting the way it is I think it will sell off after earning regardless of good or bad news.
My price targets are the green lines.
-
Not financial advice.
