Boeing in oversold conditions tends to bounce trendsif we take a look at the 3 month chart of Boeing, after hitting the low point of RSI it seems to get a meaninful bounce and coming up based on the market another bounce is due.
4BA trade ideas

MAYDAY!!! MAYDAY!!!It doesn't looking good for BA.
Very important level of support was broken on Friday.
Now, it could be a fake breakout and bounce back from this Fib 0.5 level like it did before.. but the weekly candle closed below that level with heavy volume of sellers.
Now we need to watch for test this previous support which is now turned resistance and if the sellers will push it down (what is most likely to happen), I will take a short position with good R:R to the next major support that seat right on Fib 0.618 and also nice gap that need to be filled.
Good luck ,
Trade safe.

Boeing with a possible bull runBoeings always a pain in the neck just when things look good, they get awful.... none the less when its time Boeing is really going to hit strong resistance at 192 and 196 and break out at 212 to 229 and that's when we see this thing fly and that's the bull case the bear case could be as ugly as 140-156 within 10 market days but at that point i would go long im sure behind the scenes Boeing is doing what its always done and that's monopolize sales at any cost. Also, when Boeing moves American airlines tends to follow but with oil prices so high airlines tend to do bad so be careful if you think that's the case here aal ccl all these companies have been bad investments period for the past year and only good for easy day trading. let's see what else oh yeah Boeing has a huge upside to defense as well and well look for any deals in Lockheed Martin their gone baby gone... this is one of the better stocks at a really good price if you buy stock just look to add between here and $156 don't worry about the bottom you probably will wake up and its up $40 bucks on good news that's how Boeing works.

RectangleBA has broken the bottom trendline of the rectangle, again. A rectangle is a neutral pattern until a trendline has been broken and there is a confirmed trend in that direction.
Price is below the longer term moving averages, the 20, 50, 100 and 200.
Mid Rectangle is 210.40 which can be used for a stop either way. For now it does appear that the rectangle is breaking to the downside.
No recommendation.

Sorry guys and girls! Yeah, so I am usually extremely short biased on this stock.
The SECOND I post something with a HINT of short term bullishness, this happens.
You're welcome bears. Sorry bulls, my bad :(.
Anyway, I was wrong. I thought the market wanted to wait a little longer to sell off and I thought BA was well positioned in its descending channel to ward off any imminent market sell offs. But I was wrong here.
So my plan with BA. Just an FYI in advance, usually I post for day traders, but this is more for BA investors and people interested in BA stock!
So my plan going forward, I am not going to be trading BA in any direction as a day trade. I am going to be waiting for BA to hit my previous price target ranges, which are essentially:
1. 170s
2. 160s
3. 150s
It is possible for this to go to the 140s, but not sure. This is going to be a nightmare year for the stock market and its going to be very difficult for investors (like me) to gauge when to buy and sell.
My plan is to begin re-investing in BA in the high 150s range, hedged with some OTM puts. If BA continues to fall, I will cash out these puts and use it to actually invest more.
I know BA hit a low in the 90s during the COVID market thing. But I really have a hard time imagining it will go there again. The worst case in my regression forecasts have this trading around 130s range, which again, you know, who knows really. But bear markets don't generally respond to logic, so we will see I guess.
This is my first full fledged bear market as both an investor and retail trader. That 2018 mishap is when I actively started day trading and it wasn't anything like currently. I would be interested in hearing others feedback about where they see this going.
But BA currently has past the point of no return now. Its full fledged below its pivotal support.
I am using this bear market as an opportunity to invest in companies with strong fundamentals! BA is on that list. So is RTX and CNR. All 3 are among the most under-rated stocks!
That's it! Take everyone and trade safe!

boeing seethe price kept resisiting a resisstant level wich it broke today show a strong dive to the price


$BA with a Bearish outlook following its earnings #Stocks The PEAD projected a Bearish outlook for $BA after a Positive over reaction following its earnings release placing the stock in drift B with an expected accuracy of 66.67%.

Looking for a pop to the upside BA is approaching its ascending support line in this pennant type channel its been trading in for eons.
I think it is possible for a little bit more pullback, but I am anticipating BA to do a little pop towards the upside in the coming days, if not tomorrow.
Currently, BA is resting at -2 standard deviations form its mean high, low and open range. If there is one thing BA DOES NOT like, its being more than -1 standard deviation away from its mean. It usually snaps back quite aggressively. Its actually one of the only stocks I have seen to aggressively reject trading outside of 1 standard deviation. Most stocks will tolerate it for some time, but not BA. It wants none of it. The mean range for open, low and high rests around 203, 205 and 208 respectively.
So, projections on BA for tomorrow say that BA is looking to trade in the 189 to 200 range. However, another thing BA likes to do is outperform both to the upside and downside. What I am looking for on BA is it to open around 195 or higher to show that it is rejecting being so far away from its mean.
For BA to successfully make its way up tomorrow, it must find support around the 189 range. If doesn't, then we are likely going to be retesting the mid to low 180s. This will put BA in the 5th percentile, or on the more severe side -3 standard deviations away from its mean. In that case, it either gets caught on that ascending support and gets rejected to the downside and makes lower lows, or we get that snap back that I am anticipating.
Its very possible that BA rips down to the 180s during pre-market or early in at market open, only to aggressively snap up for the remainder of the day. But either way, I am hoping for some aggressive moves from BA tomorrow.


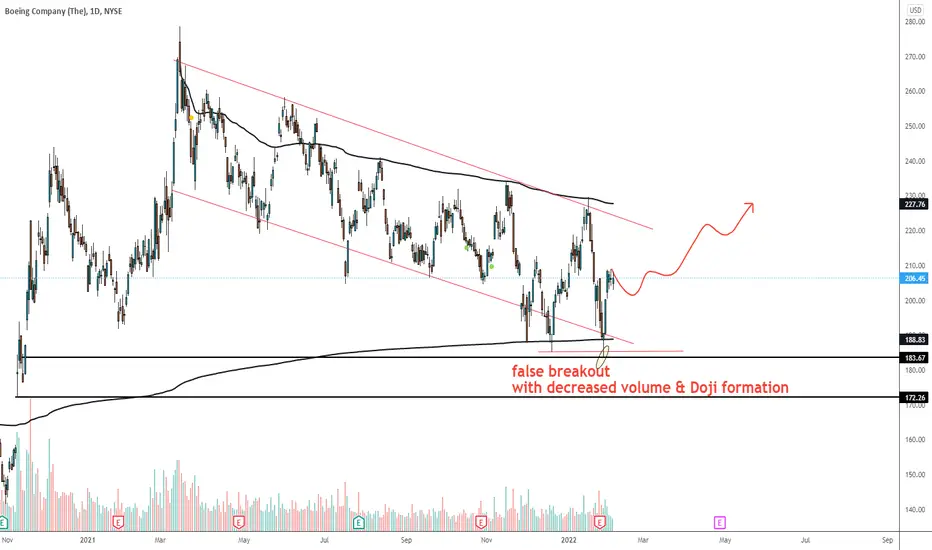
BA is on my watchlist. Here is why. Boeing is one of the biggest airplane manufacturers in the world. Alongside producing other technologies regarding the aerospace industry.
* Since 2019, Boeing has been going through tough periods and a clear bearish trend that reached an 80% decline in march 2020.
* Since there the price has been moving up, and after the breakout of the descending trendline, we have been observing a consolidation movement (yellow lines)
* These types of consolidations in the weekly chart tend to be amazing opportunities to wait for the breakout and look for trading opportunities after that.
Let's take a look at the weekly logarithmic chart:
As you can see, this is not the first time Boeing has been on a huge bearish trend. That's why studying all these previous situations may bring great insight into what we are waiting for before trading.
At the moment, my plan is: Wait for the breakout and look for a correction + study what past corrections look like in the previous scenarios. I will expand this idea after further study.
Remember: DEFINE everything in advance and wait for the price to fulfill your filter or cancel your setup. That's a powerful edge.
Feel free to share your view or chart in the comments!

BA SHORT -Looking to short BA around rejection levels from the 9&26 day emas
-Analyzing a potential retest and rejection off those EMAs looking to take a short around those levels
-Going to stay risk managed on this position as these premiums move QUICK

BOEING COMPANY (THE)As per the Technical Analysis it show strong signal towards bearish movement. So at this point seems to be short though.
Resistance: 240
Support: 183.59
Entry: 201.48
SL: 222.66
Exit: 193.31

$BA on the dailyNice bounce as expected for $BA on the daily, it bounced from that demand highlighted below.

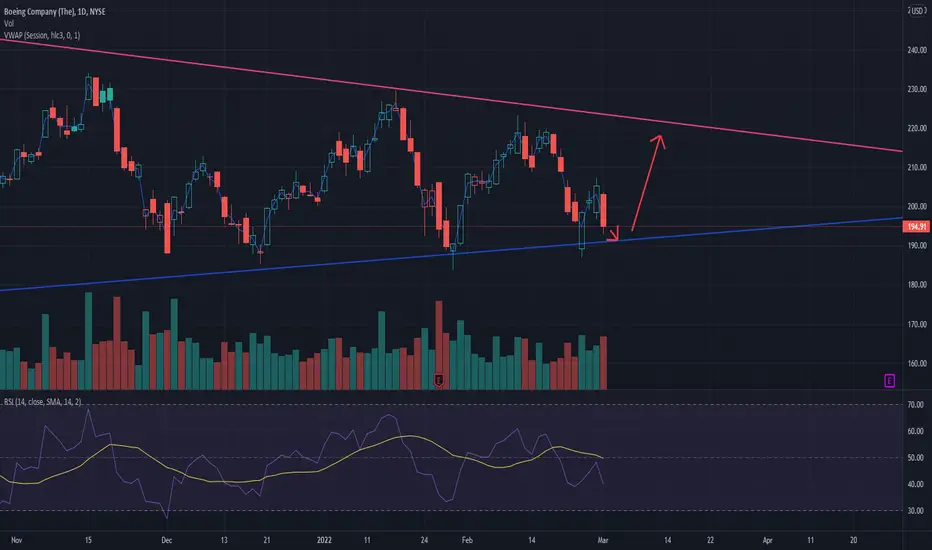
JICPT|BA range trade setup on AVWAP(188-227) Hello everyone. I just noticed BA moved between two anchored VWAP lines that I selected the start date of the high created in March of 2021 and low created in March of 2020 respectively.
In addition to the AVWAP, what really got my attention is the formation after the disappointed earning report. The Doji bar just formed at the key level. It's more like a bullish signal for me.
So, buy low and sell high. Price has consolidated for the past 3 days which may have a bullish leg-out candle tomorrow.
Give me a like if you're with me.
$BA bounced of strong demand Zone and still in the channelNYSE:BA BA bounced of strong Demand Zone , I would keep an eye on 203-204 area for rejection and short but if we clear the area with strong volume I will long it with PT $210

$BA bounced of strong demand Zone and still in the channelNYSE:BA BA bounced of strong Demand Zone , I would keep an eye on 203-204 area for rejection and short but if we clear the area with strong volume I will long it with PT $210

Boeing Should Remain Heavy For More DownsideIn Boeing, the broader view suggests that it’s correcting the cycle from March 2020 low cycle. While the decline since March 2021 high is unfolding as Elliott wave double three structure with the combination of 3-3-3 swings lower. Favoring more downside towards $167.46- $121.90 target area before it can find support for a 3 wave bounce at least. However, looking at the shorter cycles the decline from the 10 February 2022 peak is unfolding as an impulse sequence as part of a wave 3 within (C) leg lower and should remain heavy on to the bounces for more downside.
Whereas the initial decline to $207.10 low has ended wave ((i)). Up from there, a 3 wave bounce to $219.67 high ended wave ((ii)). Then a decline in wave ((iii)) unfolded in another lesser degree 5 wave structure where small wave (i) ended at $212.67 low. Wave (ii) ended at $215.88 high, wave (iii) ended at $197.82 low, wave (iv) ended at $203.25 high, and wave (v) ended at $186.88 low. Above from there, Boeing is doing a 3 wave bounce in wave ((iv)), which is expected to unfold as a lesser degree zigzag structure, which can reach as high as $199.41- $203.28 area before resuming lower once again.

Boeing MCAS incident with notes and timelineShows what boeing did during the 2 737 MAX crashes and how wall street responded

Boeing Crashing. BAImmediate targets 201, 193, 183. Invalidation 257.
We are not in the business of getting every prediction right, no one ever does and that is not the aim of the game. The Fibonacci targets are highlighted in purple with invalidation in red. Fibonacci goals, it is prudent to suggest, are nothing more than mere fractally evident and therefore statistically likely levels that the market will go to. Having said that, the market will always do what it wants and always has a mind of its own. Therefore, none of this is financial advice, so do your own research and rely only on your own analysis. Trading is a true one man sport. Good luck out there and stay safe

Boeing Is Weaving in a ChannelBoeing has drifted lower for nearly a year, and prices may be in a channel that could interest traders.
First notice the highs of June, November, January and this month. Then consider the lows of July, November and December. BA has trended within those lines, which could make some traders expect a retest toward the lows.
Next, the 200-day simple moving average (SMA) has marked the top of this pattern.
Third, stochastics showed overbought readings at each of the tops. That condition applied once again last week.
Finally this chart includes our custom script MA Speed with the 10-day SMA. The indicator is currently sliding toward the red, which previously anticipated price dips.
TradeStation is a pioneer in the trading industry, providing access to stocks, options, futures and cryptocurrencies. See our Overview for more.
Important Information
TradingView is not affiliated with TradeStation Securities Inc. or its affiliates. TradeStation Securities, Inc., TradeStation Crypto, Inc., and TradeStation Technologies, Inc. are each wholly owned subsidiaries of TradeStation Group, Inc., all operating, and providing products and services, under the TradeStation brand and trademark. When applying for, or purchasing, accounts, subscriptions, products and services, it is important that you know which company you will be dealing with. Please click here for further important information explaining what this means.
This content is for informational and educational purposes only. This is not a recommendation regarding any investment or investment strategy. Any opinions expressed herein are those of the author and do not represent the views or opinions of TradeStation or any of its affiliates.
Investing involves risks. Past performance, whether actual or indicated by historical tests of strategies, is no guarantee of future performance or success. There is a possibility that you may sustain a loss equal to or greater than your entire investment regardless of which asset class you trade (equities, options, futures, or digital assets); therefore, you should not invest or risk money that you cannot afford to lose. Before trading any asset class, first read the relevant risk disclosure statements on the Important Documents page, found here: www.tradestation.com .
