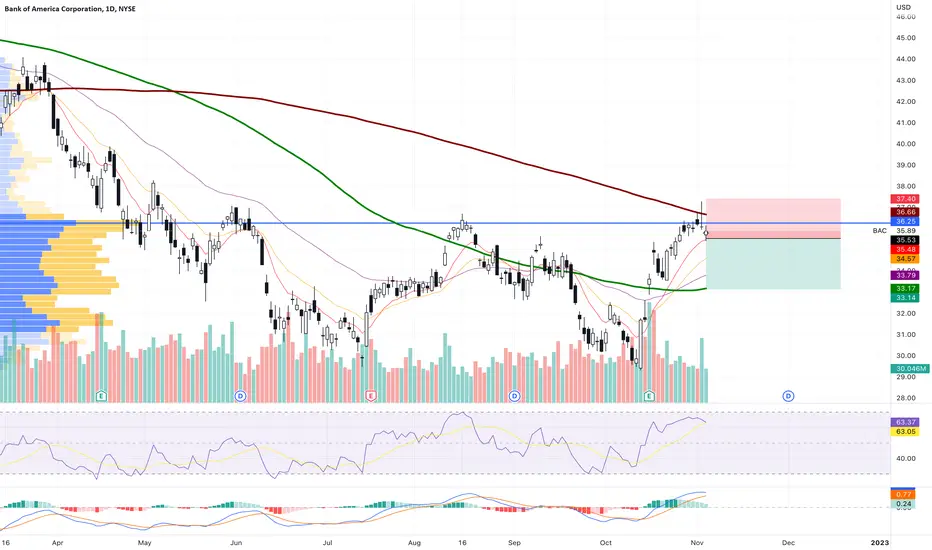
BAC: Sell ideaSell idea on BAC as you see on the chart after the breakout of vwap and support.Thanks!
4BAC trade ideas

Bank of America Long. Weekly chart.Having bounced off the lower boundary of the regression channel, B of A seems to be on the verge of a false breakdown. Looking for a close above the horizontal resistance line.


Potential Swing Trade Idea: BAC I tried to play calls at this decisional demand zone but cut early. Our sweep of our decisional demand could not get us above $30.19 so I'm expecting we drop further to demand starting at $29.60. I'm hoping see a bounce at $29.50 playing out to get us back to the highs around $31.

BAC breakout nearingI believe the charts don't lie but man is the economy f-d right now. interesting to see how this plays out.

BAC - long term short target in 2+ zoneBAC has similar to MS setup though looks to have started wave 3 of circle wave 1 already. Expect to see circle wave 1 landing somewhere in 15+ zone before a pullback in circle wave 2 sometime in 2026. Bear in mind this is the view on the financial sector, which imo is leading the market and can be used as a benchmark for the US economy. Major stocks (big tech, consumer staples, etc) still have a great chance to post new highs either in 2024 (AAPL) or 2026 (GOOGL).

$BAC Technical Analysis: Key Levels to Watch Ahead of EarningsIn this video, we'll take a closer look at the technical analysis of Bank of America ( NYSE:BAC ) ahead of earnings and identify key levels to watch. Starting with the weekly chart, we'll analyze the overall trend and momentum of the stock. Moving to the daily chart, we'll look at recent price action and important levels of support and resistance. Next, we'll examine the 4-hour chart for any short-term trends or patterns. Finally, we'll analyze the 1-hour chart to identify potential entry and exit points for traders. By the end of this video, you'll have a better understanding of the technical outlook for NYSE:BAC and key levels to watch ahead of earnings.


BAC Bank of America Medium Term OptionsI think BAC Bank of America is one of the few beneficiaries of the small banks bank run that we are witnessing today.
Big banks are the safest places where you can place your money right now.
Looking at the BAC Bank of America options chain, i would buy the $30 strike price Calls with
2024-1-19 expiration date for about
$2.85 premium.
Looking forward to read your opinion about it.

BAC Support at LowsLong idea.
BAC is a stock that has been negatively affected by the recent issues with regional bank stocks. While the bank seems fundamentally sound, I think there's an opportunity to go long for mean reversion.
Has been in a daily downtrend since the beginning of March and has hugged the 2sd 20D. However, price has stalled 26-28 and is seeing some high volume, implying big buying at these levels. A distribution has been built here at the lows, and R:R for long punt down here feels like risk is to the upside.
Buy targets are 27-28 / 26.
Profit targets are 29 / 30 / 31 / 33.

Banking turmoil took its toll on Bank of America’s share Bank of America Corporation (symbol ‘BAC’) share price was trading in a slightly upward trend because the bank failures hit mainstream media and drove the share price of BAC down. The company is expected to report its earnings for the fiscal quarter ending March 2023 on Tuesday 18th of April before market open. The consensus EPS for the quarter is $0,80 compared to the result for the same quarter last year of $0,80.
‘Bank of America could not be unaffected by the banking turmoil in early March that resulted in pushing its share price down by more than 25%. ’ said Antreas Themistokleous at Exness. ‘ As of 31/12/2022 the current ratio of the bank was at 78% meaning that they do not have the ability to repay their short term liabilities with the current assets currently in possession and this might be seen as a red flag by potential investors and traders.’
From the technical analysis perspective the price moves in a sideways momentum in the last couple of weeks after the consecutive bank failures with investor confidence still not regained even after measures from central banks. Currently the price is facing resistance on the 20 day moving average while the Stochastic oscillator is in the overbought level. The Bollinger bands are contracting showing dried up volatility in the market while the HKEX:29 price area is a strong resistance since it is made up of the 23.6% of the daily Fibonacci retracement level and also the area where the price failed to break above it since mid March.

BAC, 10d+/-13.5%falling cycle -13.5% more than 10 days.
==================================================================================================================================================================
This data is analyzed by robots. Analyze historical trends based on The Adam Theory of Markets (20 moving averages/60 moving averages/120 moving averages/240 moving averages) and estimate the trend in the next 10 days. The white line is the robot's expected price, and the upper and lower horizontal line stop loss and stop profit prices have no financial basis. The results are for reference only.

$BAC Butterfly Harmonic on the dailyNYSE:BAC hitting a butterfly harmonic heading into earnings next Tuesday.

$BAC - Hourly chart showing potential inverse head and shouldersI published a chart previously that BAC is in attractive entry zone. This is the supporting chart showing a potential inverse head and shoulders on the hourly with right shoulder yet to complete.
If the IHS materialized/validate, we can see $31.50 near term.

$BAC - Attractive entry NYSE:BAC came close to filling the gap ($25ish) created in 2020 but recovered without filling.
Target 1 - $29.44
Target 2 -$32.00
Risk - Fall to fill the gap around $24-5
——
Trade is done when it hit one of the target or stop loss is hit.
Disclaimer: Trading note. Not an investment advice.

BAC on a weekly, monthly trendline BAC, despite all the problem the banks are facing, I believe BAC is on a good price to go Long. This is a an early call to take advantage of the drops.Price is touching a very strong trend line. If price cross the trend line down close the position.
Ariel

BAC/USDHey, friends, I think the banking CRISIS isn't over yet.
The second largest U.S. bank on the brink of collapse!!!

BAC, MITK, Gold and USD pairs analysis 5/4/2023We have very good trading ideas on USD pairs and also 2 stocks that I am currently watching for possible entry. USD pairs are heading for monthly open in my opinion and I will be willing to enter if it reached there.
( 8 Min. Video)
let me know what you think and follow for more

BAC longThe Bank of America Corporation is an American multinational investment bank and financial services holding company headquartered at the Bank of America Corporate Center in Charlotte, North Carolina.

BAC: Sell ideaOn BAC as you see on the chart we have a sell idea because we have the breakout of vwap and support.Thanks!

💰 A LITTLE MORE DOWN AND THE FED WILL BEGIN TO SAVE THE BANKS 📣 Hello everyone!
I believe that the entire growth up to 2006 is the first impulse wave of the cycle, which stretched for about 33 years. From 2006 to 2009, the ABC zigzag in the wave of the second cycle adjusted the entire growth by -95%, pushing the price of Bank of America shares back 25 years.
I am now considering with a hypothesis the completion of the correction of the wave-the second cycle in 2009, and all subsequent market activity is part of a complex segmented impulse wave iii of the cycle.
Accordingly, I believe that the decline in the shares of the second bank in the United States, which began in 2022, will continue in 2023, and moreover, the decline has already begun. But according to the hypothesis I am considering, I am more inclined to believe that the downward trend, that is, this ABC zigzag will end in the area of wave-4, which is part of wave 3 of the higher intermediate level. After that, it would be logical to expect a trend reversal and the beginning of growth in the impulse wave-5 of the intermediate level with a goal of $ 62 per share approximately in 2024/2025.
The cancellation of the scenario I am considering will be a breakdown and consolidation below the level of $ 19.86, that is, the completion of wave-4 below this level. 😱 If the price is fixed below this level, it is likely that the fall may continue up to $ 2 per share, so it is worth paying attention to this key level now. ⚡️
⚠️ As always, I wish you good luck in making independent trading decisions and profit ✊
Goodbye!

