BAX Approaching Support, Potential Bounce!BAX is approaching support at 64.20 (61.8% Fibonacci extension, 61.8% Fibonacci retracement, horizontal overlap support) where it could potentially rise to its resistance at 67.52 (horizontal swing high resistance).
Stochastic (55, 5, 3) is approaching it support and a bullish divergence with price has been identified.
4BAX trade ideas

BAX Approaching Resistance, Potential ReversalBAX is approaching its resistance at 69.27(61.8% & 100% Fibonacci extension, 50% Fibonacci retracement, horizontal swing high resistance) where it could reverse down to its support at 64.70 (61.8% Fibonacci retracement, horizontal swing low support).
Stochastic (55, 5, 3) is approaching its resistance at 96% where a corresponding reversal could occur.

BAX Reversed Off Resistance, Potential Further Drop!BAX reversed off its resistance at 70.14 (100% Fibonacci extension, 50% Fibonacci retracement, horizontal overlap resistance) where price could fall further to its support at 64.90 (61.8% Fibonacci retracement).
Stochastic is pproaching its resistance at 97% where a corresponding drop could occur.


BAX: Baxter International Inc.BAX announces earnings tomorrow BMO est .71. Last earnings were incredible, and this one should be better as Hurricane Maria's damages have already been paid for. Strong expansion into foreign countries/continents such as India, Eastern Europe, and Africa.
MACD: Daily crossing showing strong bullish momentum before earnings. Already crossed and in an uptrend on the weekly.
Trendlines: Just broke past previous resistance/flag and following a loose trendline.
Moving Average: Stock just crossed over 20 ma showing short-term strength. 50 ma and 200 ma still showing strong.
In at 76.05 stop at 68.40. Very big stop as I willing to average down on the stock if earnings miss. I believe this company has incredible strength and am very bullish on healthcare at the moment.


BAX - Upward channel breakdown momentum short from $63.67 BAX seems breaking down from an upward channel. It had some recent insider selling in big quantities. It just broken down below 200 days moving average. We think it has good downside potential.
To Play this we could consider may $62.50 Puts. ($1.20 currently)
* Trade Criteria *
Date First Found- March 28, 2018
Pattern/Why- Inverse Bump & Run continuation. Upward channel breakdown
Entry Criteria- $63.67
Exit Criteria- Momentum
Stop Loss Criteria- $66.37
Indicator Notes- Twiggs money flow deep into the negative side.
Special Note- Big Money selling. Could consider may $62.50 Puts. ($1.20 currently)
Please check back for Trade updates. (Note: Trade update is little delayed here.)

BAX - LongPurchase of shares after the rebound from the support level and 200MA, which tells us about the upward trend. At the moment, almost the whole market draws the same picture, it's a pennant. It can be assumed that the market will continue to grow, based on data on the growth of long-term investments in the market and the reduction of short positions.
Open 68.76
SL 67.81
TP 72.56
A short stop allows to maintain an acceptable risk-to-profit ratio - 1: 4.
P/E 36.32
Forward P/E 21.90
Good luck!

BAX Detected possible stock repurchase this morning!!!BAX: baxter international inc
2018-02-20 09:00:27
Detected possible stock repurchase


BAX poised for another leg higher...This stock has been an absolute monster, raking in over 40% returns since December of last year. It has now reached a decision point where former support meets the lower trendline, which should both push the stock even higher. Add to that a bullish RSI reading and we've got a great risk vs reward setup. Here's the trade:
LONG: above $60.25
STOP: $59.50
TARGET: $65


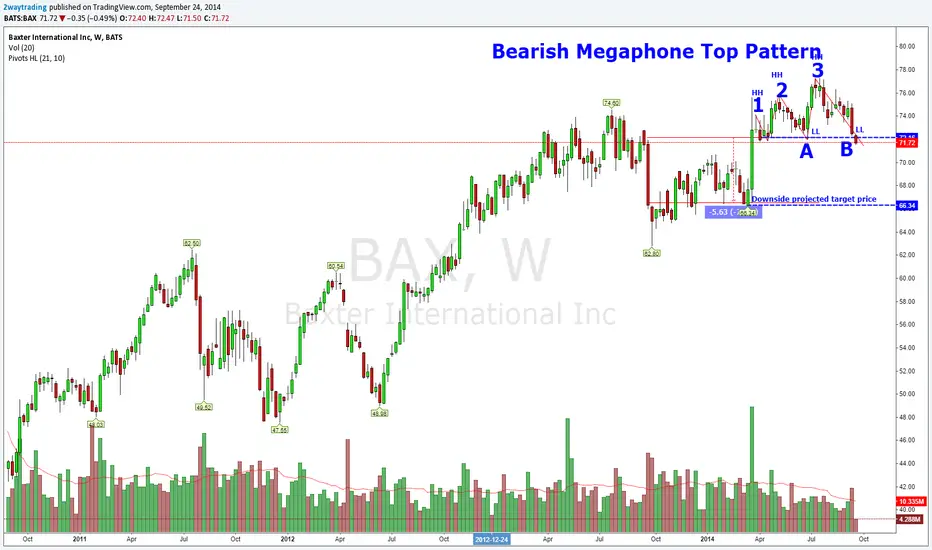
Bearish Megaphone PatternGive sometime to see if price fails to hold the support, it looks today;s close below the neckline suggest the confirmation of this bearish pattern. Expect 7% decline from today's close price. Try us www.2waytrading.com
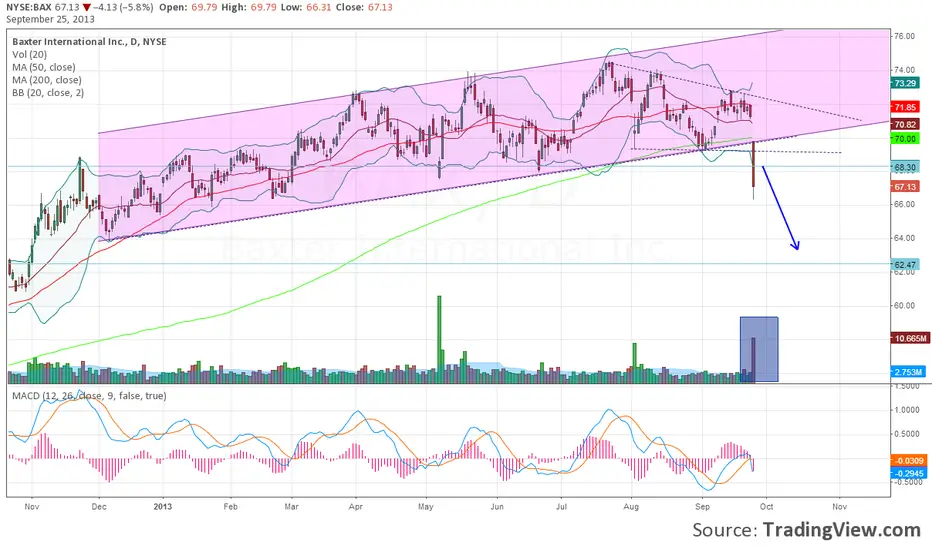
DAX Breakdown 200 MA In trading on Wednesday, shares of Baxter International Inc. (NYSE: BAX) crossed below their 200 day moving average of $69.99, changing hands as low as $67.62 per share. Baxter International Inc. shares are currently trading down about 4.7% on the day. The chart below shows the one year performance of BAX shares, versus its 200 day moving average any reverse to near 68.20 might be a great opportunity for seeling the stock OR beter getting inside Oct and Nov 13 Put options