4BBY trade ideas
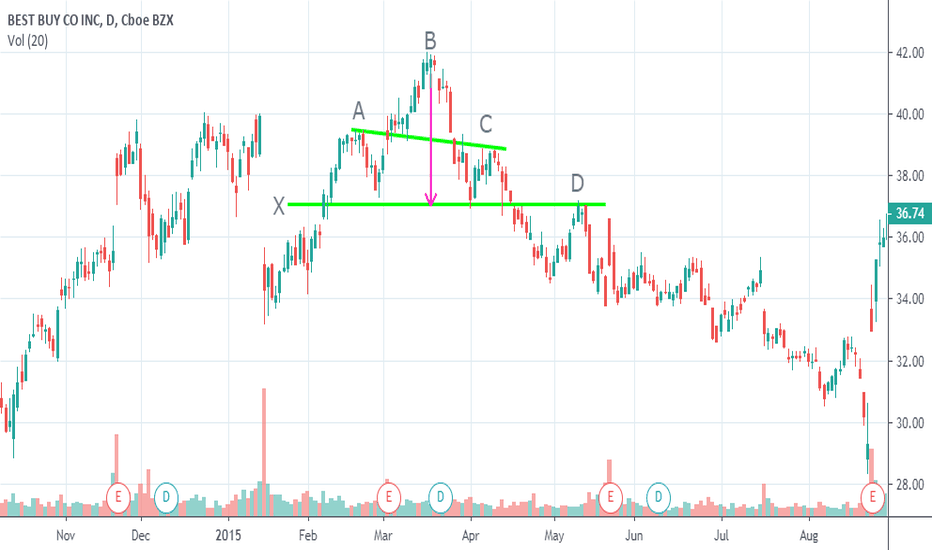
Head and shoulderThe graph shows an example of the head and shoulders for actions of Citigroup INC, where the shoulders (peak A and C) are of similar height, with peak B (head) being the highest. The distance between the head peak and the support line "X" and the Pull back at point D is shown with the purple arrow
O35.26, H35.70, L35.06 C35.40
Best Buy rated with Strong Buy and $100 targetBest Buy resumed with a Strong Buy at Raymond James. Raymond James analyst Matthew McClintock resumed coverage of Best Buy with a Strong Buy rating and a price target of $100. The analyst is positive on the transition of the company's business model from selling only consumer electronic products to offering a range of other services, which he expects will create a "much more dependable, re-occuring, and higher margin revenue stream." McClintock adds that Best Buy can generate at least a 10% earnings per share growth per year over the next 5 years, along with a low-single-digit sales increase and a 10bps expansion in gross margins.
Source thefly
P/e ratio 12.07 Good value
Yield 2.99%
Short 2.95%
Average target price $73.48 Overweight
Company profile
Best Buy Co., Inc. provides consumer electronics, home office products, entertainment products, appliances and related services. It operates through two business segments: Domestic and International. The Domestic segment is comprised of the operations in all states, districts and territories of the U.S., operating under various brand names, including but not limited to, Best Buy, Best Buy Mobile, Geek Squad, Magnolia Audio Video, Napster and Pacific Sales. The International segment is comprised of all operations outside the U.S. and its territories, which includes Canada, Europe, China, Mexico and Turkey. It also markets its products under the brand names: Best Buy, Audio visions, Best Buy Mobile, The Carphone Warehouse, Five Star, Future Shop, Geek Squad, Magnolia Audio Video, Napster, Pacific Sales and The Phone House. The company was founded by Richard M. Schulze in 1966 and is headquartered in Richfield, MN.
BBY Channel/TrianglesChannel on daily since about June 11 with a fake out to the down side. Potential Triangles forming (I'd like AT LEAST one more contact point on both the Purple and the Black to confirm triangle form, but it has potential. Right around where the Upper P/B triangle trend lines are has been weak the last 2 days. RSI is overbought and has been for a while. If these trend lines hold then we should see down side to at least the lower black TL which will be around 77 or high 76. At open it already reached around 77.05 before turning back. May not be much stopping a swift drop once all these time frames line up.
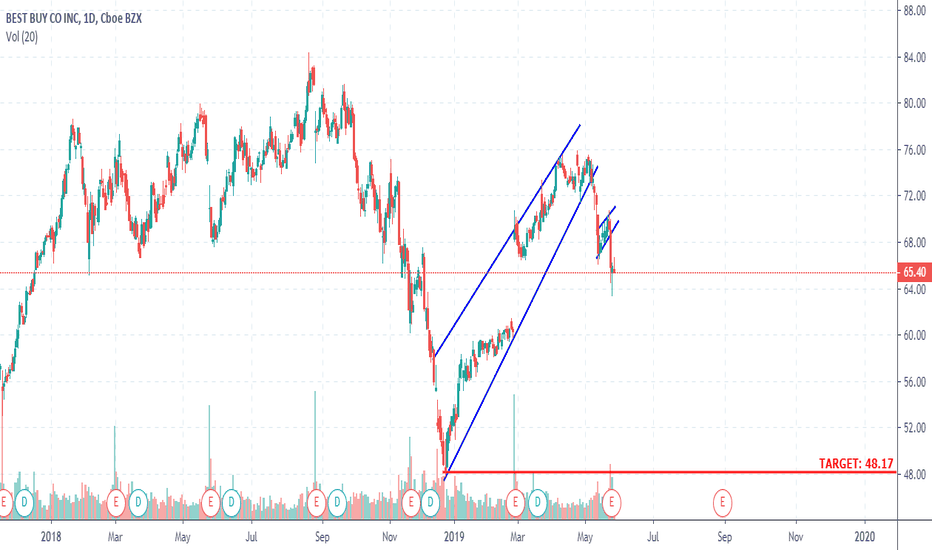
BEST BUY DAILY TIMEFRAME SHORTPrices dropped sharply before forming an ascending wedge, which topped out at the 76 price level. Now, price has already broken out of this corrective structure to the downside and is making a continuation move, with two opportunities to scale in already gone. But you can still jump in with proper risk management and target the bottom of the corrective structure, at the 48.17 price level. May the bears pounce on unsuspecting buyers lol!!
$BBY IS BEST BUY REALLY A BEST BUY NOW, PRE EARNINGS ?RETAIL HAS BEEN A NESS THIS WEEK WITH SOME REAL WIDOWMAKER DECLINES IN STOCKS, NYSE:TGT AHS BEEN THE EXCEPTION AND AS NYSE:BBY IS REPORTING TOMORROW MORNING INTO A NEGATIVE MARKET AND A NEGATIVE SECTOR, IT IS A STAY CLEAR FOR THE LONGS SIDE. THE STOCK HAS LOST SOME STEAM AND DESPITE BUYING VOLUME CONTINUING INTO THE REPORT, IT IS OUR OPINION A RISK NOT WORTH TAKING.
AVERAGE ANALYSTS ESTIMATE $76.91
AVERAGE RECOMMENDATION OVERWEIGHT
COMPANY PROFILE
Best Buy Co., Inc. provides consumer electronics, home office products, entertainment products, appliances and related services. It operates through two business segments: Domestic and International. The Domestic segment is comprised of the operations in all states, districts and territories of the U.S., operating under various brand names, including but not limited to, Best Buy, Best Buy Mobile, Geek Squad, Magnolia Audio Video, Napster and Pacific Sales. The International segment is comprised of all operations outside the U.S. and its territories, which includes Canada, Europe, China, Mexico and Turkey. It also markets its products under the brand names: Best Buy, Audio visions, Best Buy Mobile, The Carphone Warehouse, Five Star, Future Shop, Geek Squad, Magnolia Audio Video, Napster, Pacific Sales and The Phone House.
BBY approaching resistance, potential drop! BBY is approaching our first resistance at 66.19 (horizontal overlap resistance, 100% Fibonacci extension, 50% Fibonacci retracement) where a strong drop might occur below this level pushing price down to our major support at 56.93 (horizontal swing low support, 50% fibonacci retracement).
Stochastic (89,5,3) is also approaching resistance where we might see a corresponding drop in price.
Bestbuy Breakout Looking at this chart we are able to see an ascending triangle. With the rising support and same resistance there can only be two outcomes, if the resistance is broken we can look to ride the momentum to the .618 fib mark before taking profits. IF RESISTANCE IS UNBROKEN set a close stop loss; we can only sustain price level hitting the resistance few times before losing support levels.
THE WEEK AHEAD: BBY, DE, GPS, LOW EARNINGS; UNG, XOP, NFLXIn spite of the shortened trading week due to the Thanksgiving holiday, there are balls to hit out there ... .
Earnings:
BBY (95/57) (announcing Tuesday before market open): The December 21st 57.5/75 short strangle shown here is paying 2.42 with break evens near the one standard deviation line. I tried pricing out a defined risk iron condor, but it looks like some strikes need to populate post-November opex in order for me to price a setup where I'd want to set up my tent (i.e., short strikes between the 20 and 30 deltas, longs 3-5 strikes out with the setup paying at least one-third the width of the wings).
LOW (78/40) (announcing Tuesday before market open): As with the DE play, I'm able to price out a short strangle -- the 80% probability of profit December 21st 80/105 pays 1.35, but not an iron condor due to the population of strikes around where I'd like to set up. I'll just have to wait until NY open to price a defined risk setup.
GPS (87/54) (announcing Tuesday after market close): To me, it's small enough to short straddle, with the December 21st 26 short straddle paying 3.17, but I could also see going with the 23/29 (paying 1.05) to give yourself a little more flexibility with defense if you're not a fan of defending the straddle via inversion (which is generally what you have to do with a short straddle where the move is greater than the expected). Alternatively, the December 21st 21/26/26/31 iron fly pays 2.71 with a buying power effect of 2.29, which are the metrics I'm looking for out of an iron fly (risk one to make one or better; credit received at least one-fourth the number of strikes between the longs).
DE (81/48) (announcing Wednesday before market open): The December 21st 135/160 is paying 4.53 with near one standard deviation break evens; the 130/135/160/165 iron condor in the same expiry pays 1.75.
Non-Earnings Single Name:
NFLX (69/54) still has some juice in it post-earnings. The December 21st 240/245/325/330 is paying 1.56 -- not quite one-third the width, but you're only working with 33 days until expiry.
Exchange-Traded Funds:
The top symbols: SLV (100/24), UNG (100/97), EEM (63/27), OIH (77/41), and XOP (77/42). Unless you've been living under a rock, UNG, OIH, and XOP "friskiness" are understandable here, with oil prices taking a header from more than $75/bbl. to a low $20 below that since the beginning of October. Conversely, a fire got lit under natty's ass due to seasonally early weather-related pressure, shooting up from a less than a 3.50 print at the start of November to 4.93 mid-month. It's eased back to 4.39 since then, but yeesh ... . Were it not natural gas, I'd be inclined to sell premium in UNG given the rank/implied metrics, but I'm patiently waiting for my standard seasonality play -- a downward put diagonal with the front month in Jan, the back month mid year. Since we're only in November with plenty of winter in front of us, I'm satisfied with waiting on more potential upside before pulling the trigger on that setup.
With XOP and related products, I've been selling nondirectional premium, although I could see potentially skewing things bullishly, adding some petro underlying long delta to existing setups, or just taking an outright bullish assumption shot (e.g., /CL short puts, XOP/OIH/XLE short puts, upward call diagonals, etc.), since oil has been totally crushed here.
Majors:
SPY (31/21); QQQ (53/25); IWM (54/23); DIA (37/19). Temporarily, it looks like QQQ is where the broad market premium is at, followed by IWM.


