$BMY – Massive Monthly Double Top In Progress?Bristol Myers Squibb, Co. ($BMY) Weekly: After a big drop in price mid 2016, $BMY further corrected through 2017, following a fairly well outlined ABC movement, and now appears to be in a downward Motive Elliot Wave pattern. Fib extensions show a possible move down to around $38, then a further move down to $32 to revisit old support levels, set back in a lengthy sideways move between 2013-2011. We should see some support near the $48 area in the near term, where there is this 8 year trendline support, but failing to hold that level, I would expect it to hit its Fib/EW targets as shown.
Bristol Myers Squibb, Co. ($BMY) Monthly: Looking at the monthly chart outlines just how far $BMY can go. After having hit this massive monthly double top back in July of 2016, with the other head having established itself back in late 1999, it seems likely that we will see lower levels going forward for Bristol Myers. Now, it should be noted that not all tops come to realization just because one seems to exist, and the chart appears to be pointing that way – if that was the case, the markets would always stall out and move sideways, making slow upward moves over time. The key levels noted above in the weekly chart are points where $BMY can turn and move higher. For example, it CAN bounce off that trendline support and make an inverse Head and Shoulders and move back to the $68 levels and beyond. Keep eye on these levels and if they are violated or held. That will be the key to its next moves.
4BMY trade ideas

[BMY] SELL SETUPSimple Sell Setup with a interesting Risk Ratio ( > 1:3 ). Details below or on chart:
FUNDAMENTAL NOTE:
Bristol-Myers Squibb Company is engaged in the discovery, development, licensing, manufacturing, marketing, distribution and sale of biopharmaceutical products. The Company's pharmaceutical products include chemically synthesized drugs, or small molecules, and products produced from biological processes called biologics. Small molecule drugs are administered orally in the form of a pill or tablet. Biologics are administered to patients through injections or by infusion. The Company's products include Empliciti, Opdivo, Sprycel, Yervoy, Eliquis, Orencia, Baraclude, Hepatitis C Franchise, Reyataz Franchise and Sustiva Franchise. It offers products for a range of therapeutic classes, which include virology, including human immunodeficiency virus (HIV) infection; oncology; immunoscience, and cardiovascular. Its products are sold to wholesalers, retail pharmacies, hospitals, government entities and the medical profession across the world.
SETUP MODE
---------------------------------------
# ACCOUNT BALANCE: 10K #
---------------------------------------
- SELL AREA: 55.60/55.95
- STOP LOSS: 56.85
- TARGET: 52.00/51.50
=====================
MONEY MANAGEMENT
---------------------------------------
# SELL: 10.000$ (Risk: 3%) #
---------------------------------------
- SIZE: 200 lots/shares
- POTENTIAL LOSS: 300$
- POTENTIAL GAIN: 1.100$
TRADER NOTE:
Minimun Account: 1.000$ (20 lots/shares)
...Thank you for your support and trade with care!


Short-Term Drop For BMY?On April 13, 2017, the Bristol-Myers Squibb ( BMY ) 20 day moving average (DMA) crossed below the 50 and 150 DMA. Both events have never occurred before on the same day. Historically 20 has crossed below the 50 DMA 129 times, and the 20 has crossed below the 150 DMA 53 times. For all of these instances, the stock does not always drop over the following 13 trading days. The cross below the 50 has a median loss of 3.056% and a maximum loss of 24.308% while the cross below the 150 has a median loss of 4.490% and a maximum loss of 35.795%.
When we take a look at other technical indicators, the relative strength index (RSI) is at 32.6329. RSI tends to determine trends, overbought and oversold levels as well as likelihood of price swings. I personally use anything above 75 as overbought and anything under 25 as oversold. The current reading declares the stock is moving down.
The true strength index (TSI) is currently -10.3049. The TSI determines overbought/oversold levels and/or current trend. I solely use this as an indicator of trend as overbought and oversold levels vary. The TSI is double smoothed in its calculation and is a great indicator of upward and downward movement. The current reading declares the stock is moving down.
The positive vortex indicator (VI) is at 0.7249 while the negative is at 1.2883. When the positive level is higher than 1 and higher than the negative indicator, the overall price action is moving upward. When the negative level is higher than 1 and higher than the positive indicator, the overall price action is moving downward. The current reading declares the stock is still moving downward.
The stochastic oscillator K value is 14.0765 and D value is 16.5090. This is a cyclical oscillator that is highly accurate and can be used to identify overbought/oversold levels as well as pending reversals and short-term activity. I personally use anything above 80 as overbought and below 20 as oversold. When the K value is higher than the D value, the price action is trending up. When the D value is higher that the K value, price action is trending down. The current reading declares the stock is stuck in oversold territory and it has been since March 24. This indicates the stock should move up soon or price action will decrease.
Considering the moving average crossover, RSI, TSI, VI and stochastic levels, the overall direction appears to continue heading down. Based on historical movement compared to current levels and the current position, the stock could drop another 5% over the next 13 trading days.

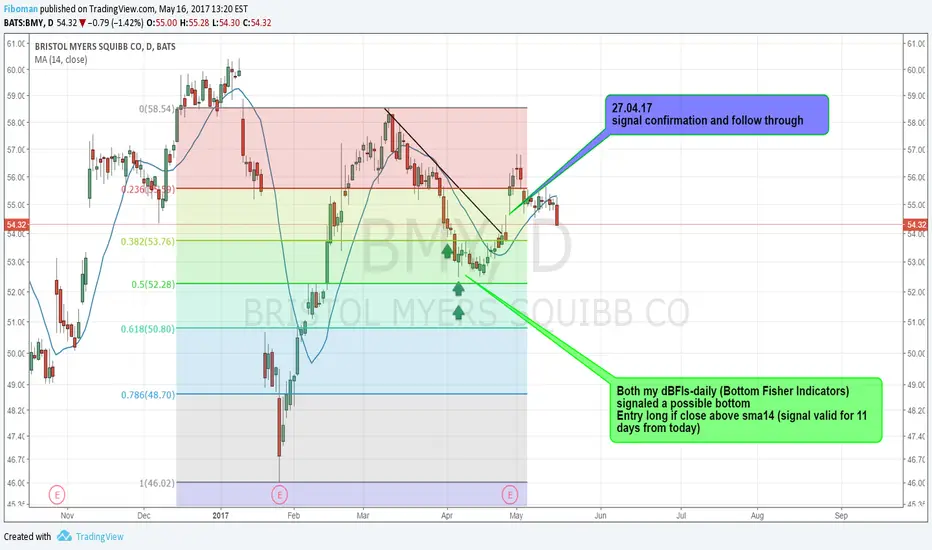
BMY - A possible bottom- Long setupBoth my dBFIs-daily (Bottom Fisher Indicators) signaled a possible bottom
Entry long if close above sma14 (signal valid for 11 days from today)

option and stock its goodi think
option
BMY strike Mar 17 57.5 Long Call Single @ 0.67
stock
buy 54.78 stop 49 T 68
Maybe
its good


BMY $2 short term profit Similar upward pattern found in past. Health care is booming for last couple weeks, which confirms this is indeed a industry trend. BMY should reach at least up to $57 in 10 days but not sure what will happen after. Moving Average Convergence Divergence looks pretty solid. Buy now $55 and sell at $57 make $2 per share in 10 days.

BMY short term 10 days profit!Similar upward pattern found in past. Health care is booming for last couple weeks, which confirms this is indeed a industry trend. BMY should reach at least up to $57 in 10 days but not sure what will happen after. Moving Average Convergence Divergence looks pretty solid. Buy now $55 and sell at $57 make $2 per share in 10 days.

BMY long swing trade off major supportBouncing off horizontal monthly support and weekly wedge bottom, clear air to $55.


Bullish Shark almost completedT1 = 46.09, T2 = 44.28. Look to reverse direction in this target zone.

US Stock BRISTOL M., H1, ShortBig move of price down observed on Daily chart, price made correction and now after created good imbalances on H1 chart I see possibility do place sell limit order on the top (not as ussually FIBO 61.8) because of gap which usually are filled.

BMY could run up to earningsBMY would be on a run up to Weekly resistance off a Daily breakout pre-earnings

Buy and Hold Signal + Bullish Pattern = High Probability TradeFor my buy and hold strategy:
I look for BlueChip Dividend Payings Stocks that have traded down to 52-week lows and the long-term daily moving averages (200, 100, 50) are respective to one another in terms of height on the graph. For example, the 200 is at the top and the 50 is at the bottom. I then add the 10ema and once it crosses the 50 I look for an entry. I also add to my position once the 10ema crosses the 100.
In addition to this signal BMY has also formed an inverse head and shoulders. For a swing trade I will look for a retest of the neckline at 57 with a stop below the right shoulder. If a flag pattern or doji form at the neck line I will enter with a much more aggressive stop.
This is the setup:
Trigger: 57
Stop: 54.01
Targets: 64.78 - 70.80 - 77
Since this is a buy and hold signal I will look to form cost-less collars with options strikes at the target areas


I'm Buying BMY Here...I love this trade. It is so pretty a girl like myself can easily fall in love. The risk versus reward is amazing as well with upside being 33% and downside being 7%. I bought 2,500 shares here. In addition, I love stocks that are like Old Faithful. They have been around forever, are not going anywhere and pay a great dividend. Yes please! I'll take 2,500! When this move begins, it really has not resistance until its target of $75. I have played this in the past and made great money and when the stock chart tells me, I play it again. It is screaming at me here. Enjoy!
I post all of my trades where they are verified right here: verifiedinvesting.com
