4BRK trade ideas

👍 Berkshire Going To Test Channel Support. (BRK.A)💰 LET'S GET INTO SOME BERKSHIRE HATHAWAY ANALYSIS!💰
1️⃣ First off SMASH that LIKE BUTTON & Give us a FOLLOW for DAILY ANALYSIS! ❤❤❤
(Overall Market Sentiment) 🐻 Bearish
- Daily Chart
- Red Engulfing Candle
- 3/3 EMA DOTS Red
It looks to me that berkshire will continue down to test the upward channel support. Look for all indicators to shift on support otherwise it could be disaster if we breached below that main level.
Best of luck to you and all of your trades this week! 🤜
Drop your charts and comments down below, share with us what you think is going on in the markets! ❤❤❤
Thanks for checking out our analysis! ✌😁✌
🥇MLT | MAJOR LEAGUE TRADER


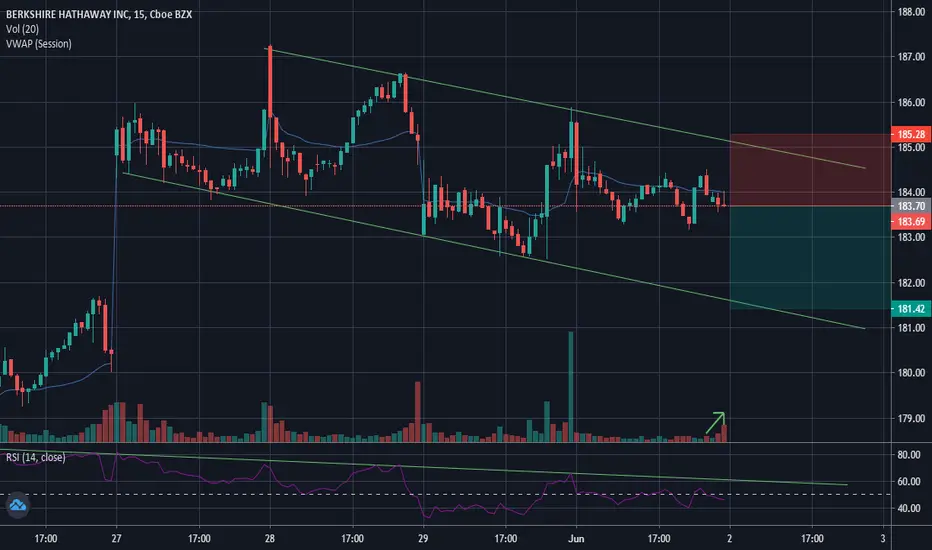
3:1 Ratio on BRK.B simpleSpeaks for itself BRK.B buy and hold investor favourite disconnected from the market either market catches it or it catches market so get the SL in and its a easy trade

Wait for the blue line to be crossed We have indications on the return of the market to rise next week
Wait for the blue line to be crossed and Buy a few and if we passed the white line buy more


Buy when the next green candle startsTechnical indicators (volume up ; candle ; tendance ligne ..) indicate a rise in the market in the coming days
The next green candle is a good time to buy

Berkshire Hathway B (BRKb - NYSE) - ABC wave patternBerskhire Hathway B (BRKb - NYSE) is in (W)(X)(Y) complex corrective double zigzag wave pattern and wave (W) & (X) has been completed. The (X) wave took 0.618 times of wave (W) by price. It is very weak compared to SPX and about 13 % holding value of XLF etf. It has now begun the (Y) wave cycle downside. Wave A impulse drop completed today in five wave and correcting up in B wave, which might take 1-3 days to complete. Thereafter wave C will be started again in down direction. This stock is major indication that XLF will go in down direction.

I Recommend SELLING We have a big red candle that broke the blue and white line, I advise you to sell, because there are signs of the market declining in the coming days.

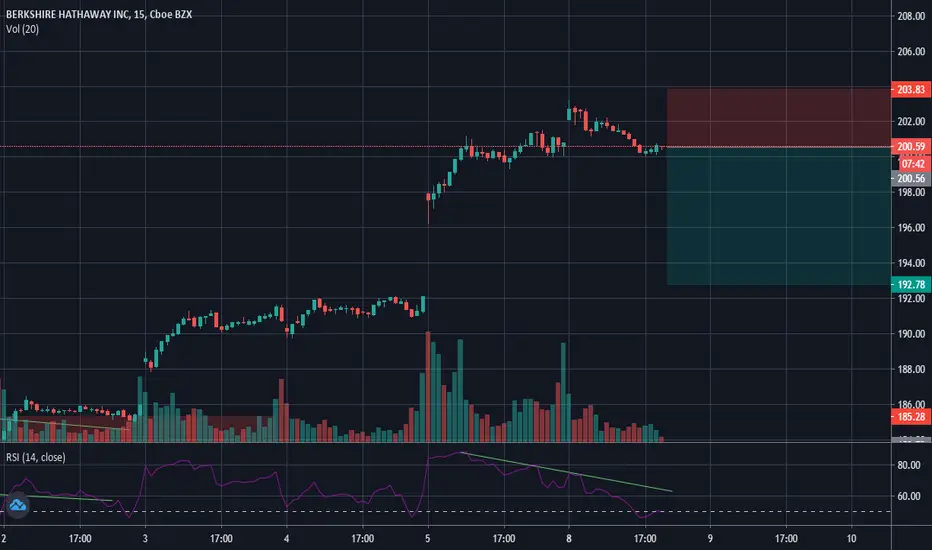
Sell signal for BERKSHIRE HATHAWAY INC stockThe stock continues to drop, supported by an important sell volume, RSI also supporting the downward movement.

Sell signal for BERKSHIRE HATHAWAY INC StockSelling this Stock can be continuing until filling the price gap last week, RSI showing also diversion and bellow 50.
berkshire hathaway daily chart analysishello friends ! i found bullish pattern in berkshire hathaway daily chart that we called double bottom pattern !
the target was showed in the picture ! if the breakpoint from bottom happend !! the analysis failed and the trend change to bearish from bullish
hope it was useful for you my friends .
#berkshirehathaway #stock #wallstreet #stockmarket #nyse
NYSE:BRK.B


THE BRYN STOCKMORE POTENTIAL THE BRYN STOCK GOING UP INITIALLY TO TP 1 ( 182.89 ); BUT IF THIS STOCK BREAK OUT THIS RESISTANCE WE CAN REACH UP THE 200.00 PRICE.


Sell signal for BERKSHIRE HATHAWAY INCThe stock looks forming a small intermediate downtrend Channel, this support with a clear diversion on RSI, also the last volume data reflects the selling pressure
BRK.B - I would rather buy the airline holdings they are sellingNot that I would buy the airlines here, but this looks like the best sell of the bunch. There are no technical indicators that are bullish, and its got plenty of drop space.

BERKSHIRE HATHAWAY Analysis (BRK.B)As long as NYSE:BRK.B doesn't close in an upcoming week above around the 196 , I think there wouldn't be a reason to assume it would go considerably up and really recover .
If it does close in an upcoming week above the 196 significantly It would confirm a considerable bullish move.
I have illustrated some of the potential scenarios in the chart .

BERKSHIRE HATHAWAY INC (BRK.B) Trading Plan
Very sexy inverted head and shoulders pattern is forming on berk.
117.0 is our horizontal neckline.
First, we need a 4H candle close above that to confirm a breakout.
then we can buy on retest of the broken structure expecting a further bullish continuation.
target levels are:
183.0
190.0
196.0
stop is below the right shoulder
if the market goes below the right shoulder,
setup will be invalid.


BRK.B Volume Spread AnalysisNYSE:BRK.B
Solid accumulation done by smart money and test being done with a stopping volume in 4hr time frame. Looking at putting in some Call option entry upon market open =)
