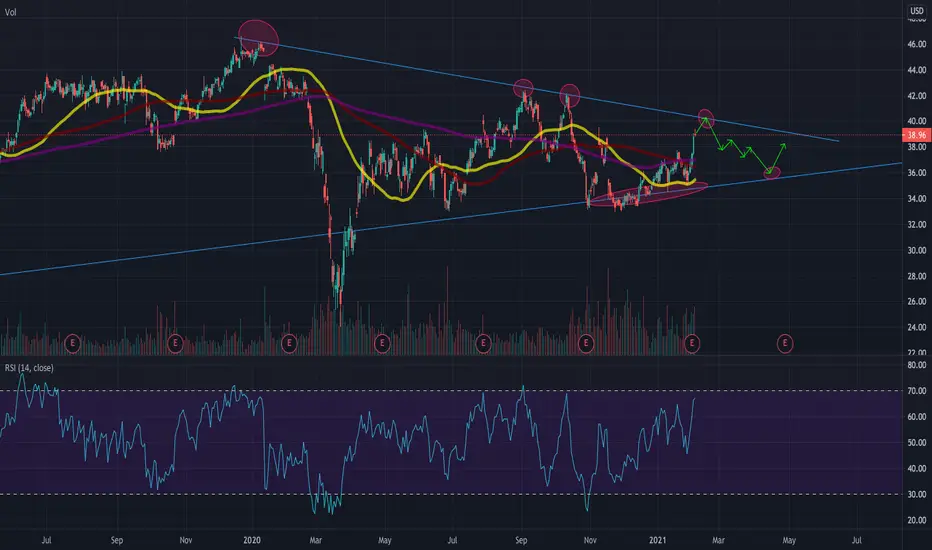
$BSXVery large 3 year consolidation that will lead to a big breakout. $BSX holding relative strength in this market environment
4BSX trade ideas

BSX - Chart Patterns EverywhereAreas in white rectangles show very similar price pattern and both lead to a should of the head and shoulders pattern present on the diagonal uptrend line
A larger double top can be observed between these two peaks
All these assumptions support a downward move on this Weekly timeframe

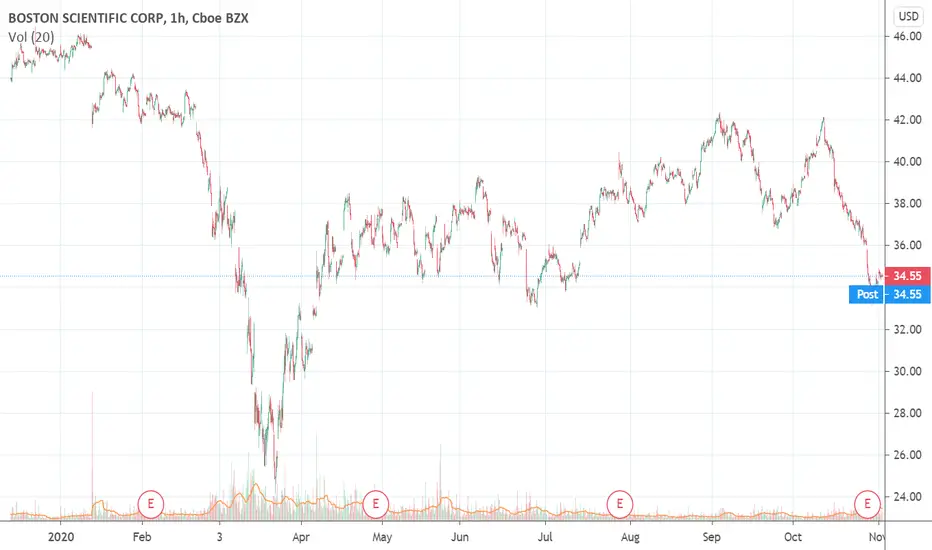
$BSX with a Bullish outlook following its earnings #Stocks The PEAD projected a Bullish outlook for $BSX after a Negative over reaction following its earnings release placing the stock in drift C with an expected accuracy of 66.67%.

BSX Cup and Handle Target ~$90Seems to be performing relatively well, just posting for future reference the C&H seems pretty blatant so interested how it will turn out. Mostly I just like the company.

BSX - What is next ? Short or Long ?Hallo dear Traders and investors,
I may have a shorting opportunity, but we still need a better confirmation about the trend.
In the monthly chart above, the BSX stock hit a critical resistance with bearish divergence in RSI.
The Fibonachi shows the following from the very lows of 2011 (still in monthly chart)
0.236 => $36.5
0.382 => $30.3
0.5 => $25.5
0.618 => $20.6
From Weekly chart, we have the following Fib. from the lows of March 2020:
0.236 => $41
0.382 => $37.7
0.5 => $35
0.618 => $32.5
I appreciate your comments and analysis for this stock.
Thanks,
Sam.

BSX Ascending Triangle into ATH$BSX is setting up an ascending triangle into all time highs. There has also been a decrease in volume shown associated with an ascending triangle. In addition, the larger health sector has been performing well as evidenced by XLV
Entry: 44.5-46
Stop Loss: 43
Profit Target: 50


Boston Scientific Receives FDA Clearance for EXALT™ Model B SingBSX: Boston Scientific Corporation
2021-08-10 16:00:00
Boston Scientific Receives FDA Clearance for EXALT™ Model B Single-Use Bronchoscope

BSX w 24 2021. Open Long to 78.Weekly
Stable uptrend + bullish sector
Cup and Handle formation
Will be break out to UP.
Better to pick Long now
Daily
Uptrend
I think company worth to buy now.
It has very good potential to double assets before 2024.
When CUP and Handle Formation will be finished.
Open 43
SL 25
TP 78
RR 3,5


$BSX Making a Run for R2-Analyst PT $49
-Beat last 3 out 4 last ERs
-Has been on an uptrend Since Jan 2021
-Very nice W pattern formation
-Bouncing off S1 before it makes a run for R1 and then R2
-Bernstein Conference on June 4th
- Unusual $OPT Activity as well, will send out alert


BSX: A name to remember. Must have in the portfolio.This is on a monthly. Gigantic Cup and Handle formation and upcoming earnings. Deadly combo. Near term prices marked.
gl

$BSX bear trap played out - watch or start to get inBSX has just finished a pretty nice bear trap. I started a initial position, and will fully get in if the price broke through $40 pivot line. If you look at the weekly or even monthly graph, you can see a 16-year huge cup and handle forming. Expect huge up-side to play out in 2021 or 2022. If you want to buy call, buy 2023 leaps.

$BSX with a Bullish outlook following its earnings #Stocks The PEAD projected a Bullish outlook for $BSX after a Negative over reaction following its earnings release placing the stock in drift C
If you would like to see the Drift for another stock please message us. Also click on the Like Button if this was useful and follow us or join us.

BSX Long In Wedge consolidation
Volume went done
SMA50/200 as Support
Entry 38.7
Stop 36.7
Target 46
I am not a PRO trader. I trade option to test my trading plan with small cost.
The max Risk of each plan is less than 1% of my account.
If you like this idea, please use SIM/Demo account to try it.

downtrend resistance coming into play!could see some more green, but the upside is limited if it keeps bouncing down from the trendline resistance.. bullish if trendline breaks though! for now i think we should look at the 35-36 area for a dip entry! goodluck guys :)
Long #BSXNYSE:BSX
From a technical standpoint #BSX is reporting a divergence between RSI and Price, in addition the MACD is sloping up leading us to think that a move to the upside is imminent.
The MACD, still below 0, correctly describe the negative momentum: we expect for the near future to retest the upper end of the downward channel at $ 36.50.
Buy price: $ 33.69
1st target: $ 35.00
2nd target: $ 36.00
Stop loss: $ 32.80


Achat BOSTON SCIENTIFICJ'achète ce titre sur le support qui fait le job
TipRanks target : 43$
je vies 42.20$


BSX LongDemand Zone below Sideway Consolidation
Entry 34.5
Stop 32.5
target: 42;
I am not a PRO trader. I need few months to practice trading strategies.
If you like this idea, please use SIM/Demo account to try it, until my trading plans get high winning rate.

Boston Scientific Receives FDA Approval for the Ranger(TM) Drug-BSX: Boston Scientific Corporation
2020-11-02 09:41:00
Boston Scientific Receives FDA Approval for the Ranger(TM) Drug-Coated Balloon